Print This Page
|
Print This Page |
Close Window |
2003 Water Quality (Chlorophyll) Threshold Data
for Maryland's Coastal Bays
On or about August 18, 2004, The Maryland Department of Natural Resource will
be releasing its "State of the Coastal Bays" report. The report is a comprehensive
study of Maryland's Coastal Bays water and habitat quality, and ecosystem health.
A section of the "State of the Coastal Bays" report focuses on the assessment of water quality thresholds using spatially intensive data that is collected as part of the Eyes on the Bay Water Quality Mapping Program. One element of water quality is the concentration of chlorophyll in the water column, which is an indication of the intensity of algal blooms. For this analysis a chlorophyll threshold of 15 micrograms/liter was examined. Values above 15 are considered harmful to the growth of submerged aquatic vegetation because dense algal blooms can block light penetration through the water column. Underwater plants, just like terrestrial plants, need light to grow.
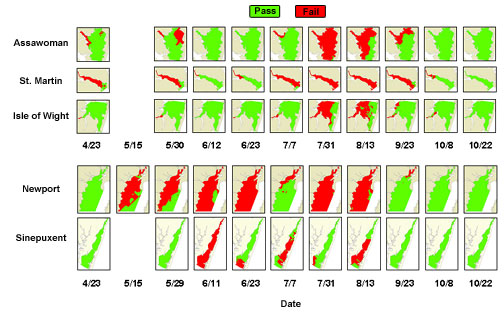
Bi-monthly water quality mapping cruises were conducted throughout Maryland's Coastal Bays in 2003 and will be continuing through at least 2005. During each cruise approximately 10,000 datapoints of numerous parameters (chlorophyll, dissolved oxygen, turbidity, water temperature, salinity and pH) are collected. These data are then spatially interpolated to create continuous surface maps of water quality. In the map below, 2003 chlorophyll maps of bi-monthly cruises from five coastal bays segments (Newport Bay, Sinepuxent Bay, Isle of Wight Bay, St. Martin River, and Assawoman Bay) are shown. Areas passing the chlorophyll threshold of 15 micrograms/liter are shown in green and those failing are shown in red. Newport Bay and St. Martin River experience the highest occurrences of failures in space and time. In each segment, you can observe how chlorphyll levels were lowest in the early Spring and Fall and higher in July and August.
Pass / Fail Regions of 15 micrograms/liter Chlorophyll
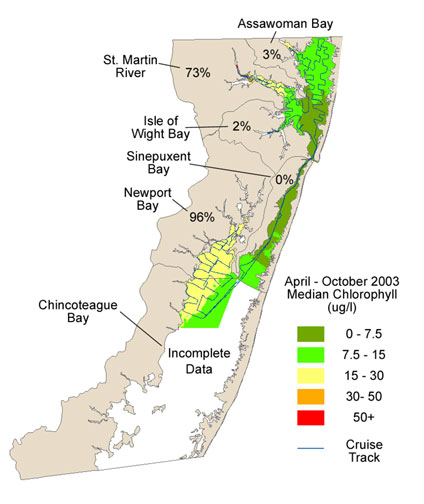
The map below is another representation of the data shown in the figure above. Median chlorophyll values throughout time were calculated at each pixel to obtain a yearly median map. The percentage of area in each segment that failed the chlorophyll threshold was then computed and is shown as percentages on the map. Newport Bay had the highest area failing (96%) followed by St. Martin River (73%). It should be noted, however, that failing chlorophyll values in Newport Bay were usually only between 15 and 30 micrograms/liter throughout 2003, while failing values for St. Martin River were often above 30 or even 50 micrograms/liter. Sinepuxent, Assawoman, and Isle of Wight Bays each had low (<5%) percentages of area failing, but this is partly the result of higher salinities and flushing rates. For more information on these data, contact Mark Trice.
2003 Median Chlorophyll Values