Hurricane Isabel Water Quality Impacts
Hurricane Isabel swept through the Chesapeake and Coastal Bays region on Thursday,
18 September 2003. Winds gusted to near 60 mph in some areas (Figure
1). As winds gusted and the low pressure system moved into the region, a
tidal surge of water was forced into many of the Chesapeake and Coastal Bays'
tributaries. Water levels in Annapolis, Maryland reached 5 feet above normal
tidal levels, peaking at 7 feet above mean low water (Figure
2). Rainfall associated with Hurricane Isabel was lighter than anticipated,
however the impacts of fresh water run-off on many systems is still being evaluated
(Figure 3). The impacts of this tidal surge
were observed at the Stonington
continuous monitoring station in the Magothy River where a slight increase
in salinity was observed and turbidity levels increased substantially (Figures
4 and 5). Water levels and water quality measures have returned to normal
since the storm has abated.
Download the Initial
Assessment of Hurricane Isabel's Impacts on Aquatic Resources (PDF)
 Figure 1
. Wind gust data (mph) during 15 - 22 September
2003 from the Horn Point Laboratory weather station in Cambridge Maryland.
Data courtesy of Horn Point Laboratory/University of Maryland. |
 Figure 2
. Water level data during 15 - 22 September 2003
from the NOAA/NOS/CO-OP water level station in Annapolis, Maryland. Data
courtesy of NOAA/NOS/CO-OP. |
 Figure 3
. Weekly precipitation map for the Chesapeake
and Coastal Bays region during 15 - 22 September 2003. Data courtesy of
WSI Corporation. |
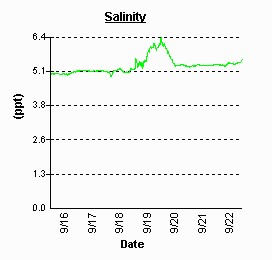 Figure 4
. Salinity data during 16 - 22 September
2003 from the continuous monitoring station at Stonginton on the
Magothy River. |
|
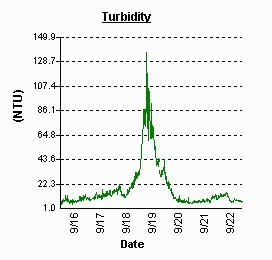 Figure 5
. Turbidity data during 16 - 22 September
2003 from the continuous monitoring station at Stonginton on the
Magothy River. |
|
 Print This Page