Historical Trends Used to Assess 2002 Drought
Monthly data from the Eyes on the Bay Monitoring Program enables the comparison of current monthly data to
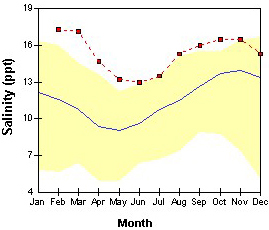
historical trends. The salinity graph from the Jack
Bay station on the Patuxent River illustrates the severity of the
2002 drought, with all observations (February - November 2002) of salinity
exceeding the maximums from 1985 through 2001. Periods of decreased rainfall
reduces the amount of freshwater flow into the Bay, thus increasing the salinity.
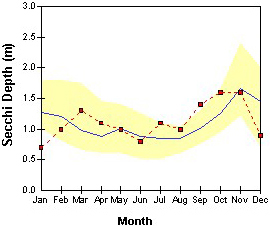
Water clarity in general, as indicated by secchi depth, was above average in
2002 due to the lack of rainfall, whcih decreased sediment and nutrient inputs
to the Bay.
 Print This Page