Print This Page Return to the Map Eyes on the Bay


Potential Effects of Spring 2009 Rainfall on Chesapeake Bay Water Quality and Biota

• The Chesapeake Bay region experienced higher than normal rainfall conditions in recent months. While the period of January through March of 2009 was the second driest on record, the period of April through June was the second wettest on record.

Percent of Normal Precipitation June2009

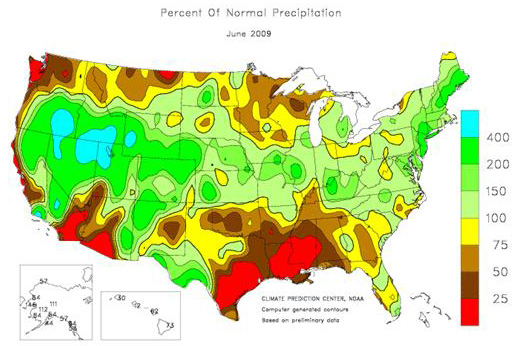
This graphic shows the nationwide percent of normal precipitation for June of 2009. Note that the Chesapeake Bay region is above 100 percent and that certain regions have received greater overall rainfall than others within the watershed. NOAA Weather Service (http://www.cpc.noaa.gov/products/analysis_monitoring/regional_monitoring/us_monthly_pct_precip.shtml)


• Compared to recent years, rainfall in May and June of 2009 was more evenly distributed, and prolonged periods of dry weather were not seen. This temporal distribution of precipitation events may have allowed more rain to seep into the ground, producing less runoff. However, additional rainfall on already saturated ground may have led to flooding events, pushing more polluted water into the Bay.

• The 2009 rainfall pattern has been localized spatially, with above average rainfall along the western shore of the Chesapeake Bay, and closer to average rainfall on the eastern shore and in the upper reaches of the Chesapeake watershed.

USGS Jan. - June 2009 Dialy Discharge at Conowingo Dam

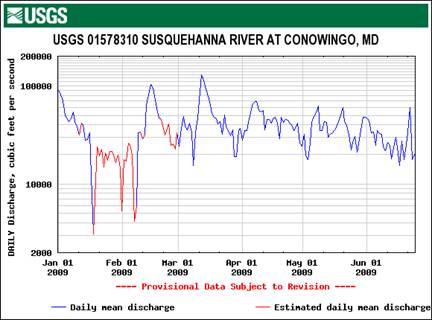
This chart shows daily discharge in the Susquehanna River. Note the lack of large flow events through the spring.

USGS Daily Mean Discharge Jan - Jun 2009 Point of Rocks, Potomac River

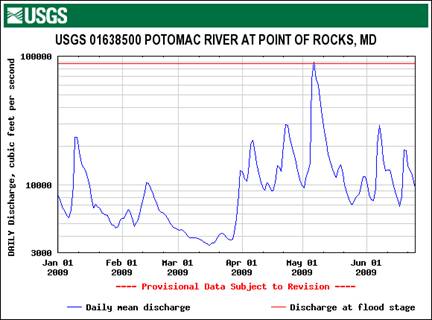
In contrast, this image shows the discharge at Point of Rocks on the Potomac River. Note the increased flow events throughout the spring months. These two images demonstrate the regional differences in rainfall throughout the Chesapeake Bay watershed.

10-Jun-2009 NASA MODIS AQUA True Color Satellite image

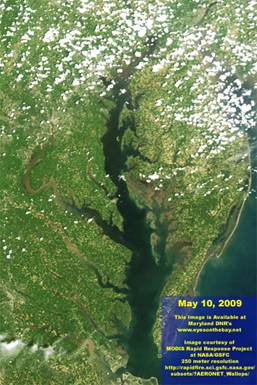
This graphic shows a satellite image of the Chesapeake Bay following a rainfall event. Note the brown sediment streams moving down the rivers toward the Bay.

Water clarity (as measured by Secchi depth) for station CB4.2C in the main channel Chesapeake Bay.

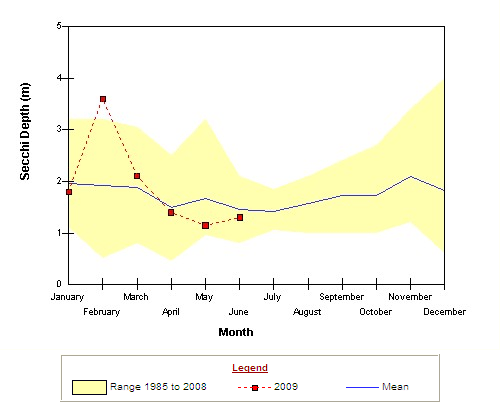
Water clarity (as measured by Secchi depth) for station CB4.2C in the main channel Chesapeake Bay. The red dashed line indicates 2009 Secchi depth against the long-term mean (solid blue line) and long-term range (yellow shaded area).

• Mid-channel water clarity was below the long term average throughout most of the Chesapeake Bay between April and June 2009. Sediment washed into the water column, as well as algal blooms, contributed to decreased clarity. Poor water clarity, along with prolonged overcast conditions, block sunlight from reaching submerged aquatic vegetation (SAV). This might impede the recent resurgence of SAV in the northern Chesapeake Bay and tributaries.

• Heavy or prolonged rainfall can increase nutrient levels in the Chesapeake Bay as more polluted water washes into streams and rivers. High levels of nutrients can lead to algal blooms. Bloom levels of the algae Prorocentrum minimum were recorded throughout the Chesapeake in May and rival significant blooms seen in 1998 and 2000. An observed decrease in water clarity in the middle Chesapeake Bay, decreases in dissolved oxygen, and a fish kill of over 3,000 fish in Baltimore Harbor were all likely caused by an algal bloom.

• The hypoxic volume (dissolved oxygen between 0.2 and 2 mg/L) of the Chesapeake Bay for June 2009 was among the highest since 1985. In addition, bottom dissolved oxygen was below the long-term average over most of the mid-channel Bay. Organic matter washed into the Bay, as well as decaying algal blooms, fueled hypoxic conditions near the bottom. Fresh rainwater also contributed to the formation of a strong salinity gradient, forcing greater hypoxic conditions in the saline waters near the bottom. A recent prediction by researchers at the University of Michigan suggests improvement in bottom dissolved oxygen conditions due to drier months earlier in the year. Despite the recent rainfall, researchers still believe dissolved oxygen conditions will improve overall, but not as much as originally expected. However, as is evident in the graphic below, current data do not support this argument.

Column Chart, hypoxic volume for the Chesapeake Bay1985 - predicted 2009

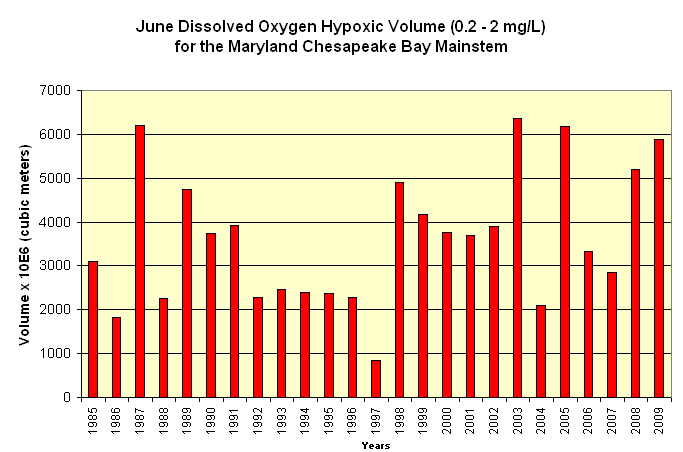
This analysis indicates that the June 2009 hypoxic volume for the Chesapeake Bay is among the highest since 1985.

map shows spatially interpolated June 2009 dissolved oxygen concentrations for the Maryland Chesapeake Bay.

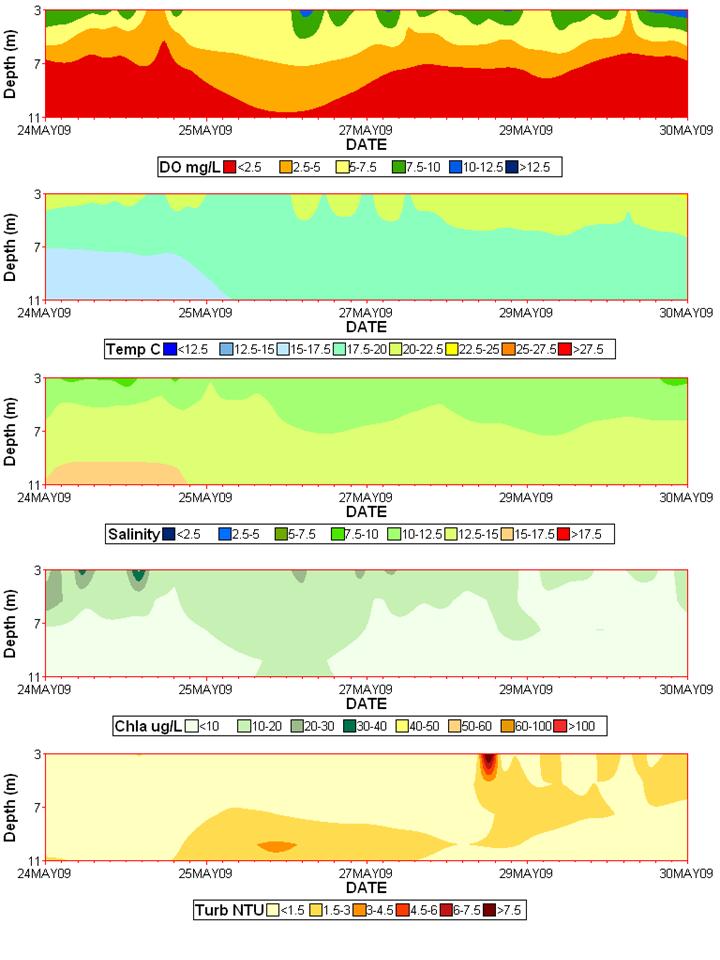
• Rainfall events can cause algae blooms to flush out of a particular area. Such an event occurred during the first week of deployment of DNR’s vertical profiler in the lower Potomac River. High surface chlorophyll concentrations, indicative of an algal bloom, dissipated following 2.2 inches of rainfall on May 26th. The salinity gradient evident earlier that week was also disrupted by the influx of rainwater. See the graphics on the next page for details.

• Oysters may have been affected by the disruption of average salinity conditions by the prolonged April-May rainfall. Prolonged low salinity could disrupt oyster reproduction. However, the parasites causing oyster disease will likely persist in small concentrations, and oyster mortality should remain at the same low level as the past few years.

24-30 May 2009 Water Column Profile Contour plots of DO, WTemp, Salinity, CHLa, Turbidity

Observations from the vertical profiler in the lower Potomac River show water quality conditions through the water column during and after a rain event. On May 26th, BWI Airport recorded 2.29 inches of rain. Prior to this date, the water column was stratified (see salinity plot above) and a temperature gradient was present (see Temp C plot above). After the rain event, the water column became more uniform in salinity and temperature as fresh water washed into the system. The loss of stratification is also evident in that dissolved oxygen levels showed less severe hypoxia near the bottom (see DO plot above). In addition, an algae bloom prior to the rainfall event dissipated and sank through the water column (see Chla plot above), perhaps causing a spike in bottom turbidity (see Turb plot above). Turbid conditions persisted following the storm.

Water quality data, Maryland DNR website: www.eyesonthebay.net .