MD DNR Continuous Water Quality Monitoring Project 2022

Metadata also available as - [Questions & Answers] - [Parseable text] - [XML]

Metadata:

Identification_Information:
Citation:
Citation_Information:
Originator:
Maryland Department of Natural Resources, Resource Assessment Service (MD DNR RAS)
Publication_Date: 20230302
Title: MD DNR Continuous Water Quality Monitoring Project 2022
Geospatial_Data_Presentation_Form: Spatial dataset
Description:
Abstract:
Water quality was monitored at twenty-one Maryland shallow water sites located in Chesapeake Bay and Chesapeake Bay tributaries during 2022. At most stations, YSI (6600 V2 or EXO2) data loggers sampled seven environmental parameters: water temperature, specific conductance, dissolved oxygen concentration, oxygen percent saturation, pH, turbidity, and fluorescence. At three stations within Fishing Bay, YSI EXO1 data loggers sampled a subset of parameters: water temperature, specific conductance, dissolved oxygen concentration, and oxygen percent saturation. Water depth was measured at stations where loggers were deployed at fixed depths. Salinity and chlorophyll were derived from specific conductance and fluorescence, respectively. Each parameter was sampled at 15-minute intervals. The number of days that data were collected at individual stations ranged from forty-one to three hundred sixty-five.
At station XDA8236 (Mallows Bay Buoy) a weather station was deployed in conjunction with the water quality monitoring equipment that provided real-time data on air temperature, barometric pressure, and wind speed and direction. The latest real time reading is available on the Mallows Bay buoy weather page <https://eyesonthebay.dnr.maryland.gov/contmon/mab_weather.cfm>.
At three stations in which 6600 V2 data loggers were deployed, sondes were exchanged bi-weekly when logistically possible. For eighteen stations at which EXO2 or EXO1 data loggers were deployed, sondes were exchanged every two to four weeks because these loggers are equipped with more advanced monitoring technology that allows for longer deployments. Data loggers deployed from November through March were exchanged monthly because less biofouling, which may compromise data integrity, occurs during cold weather months. Data loggers were deployed simultaneously at two depths at station XIE7136.
When data loggers were exchanged, water samples for pigments, suspended solids, and nutrients from select stations were collected for later analyses. At the same time, Secchi disk depth was measured and a Hydrolab (series 4a or 5) or EXO water quality sonde was used to collect discrete water temperature, salinity, dissolved oxygen and pH data. Light attenuation was also measured using a LI-COR instrument.
Purpose:
The Maryland Department of Natural Resources Shallow Water Monitoring program is part of a cooperative effort between the Federal government and State and local governments in the Chesapeake Bay watershed to assess the ambient water quality criteria for dissolved oxygen, chlorophyll, and water clarity in shallow water habitats. The Shallow Water Monitoring Program includes two components, the Water Quality Mapping Project and the Continuous Water Quality Monitoring Project. Details of the Water Quality Mapping Project are documented in a separate document.
Continuous Water Quality monitoring data describe the 2022 state of twenty-one shallow water sites on Chesapeake Bay and associated tributaries using key water quality indicators.
The information is integrated with data from other Bay water quality stations and living resources monitoring projects and used to understand linkages, temporal variation and long-term trends.
Water quality data are used to refine, calibrate and validate Chesapeake Bay ecological models. The models are used to develop and assess water quality criteria with the goal of removing the Chesapeake Bay and its tidal rivers from the U.S. Environmental Protection Agency 303(d) list of impaired waters.
Supplemental_Information:
The target audiences for this information include Resource Managers, Technical/Scientific Users, Government, Educators, Students and General Public.
Data users who desire very detailed information about Water Quality Monitoring data definition, sampling procedures and data processing are encouraged to refer to the documents listed below.
Water Quality Database - Database Design and Data Dictionary Prepared For: U.S. Environmental Protection Agency, Region III, Chesapeake Bay Program Office, January 2004. <https://d18lev1ok5leia.cloudfront.net/chesapeakebay/documents/cbwqdb2004_rb.pdf>. An updated version of the data dictionary is a Chesapeake Bay Program work in progress.
Guide to Using Chesapeake Bay Program Water Quality Monitoring Data, EPA 903-R-12-001, February 2012, CBP/TRS 304-12 <https://d18lev1ok5leia.cloudfront.net/chesapeakebay/documents/wq_data_userguide_10feb12_mod.pdf>
Methods and Quality Assurance for Chesapeake Bay Water Quality Monitoring Programs, May 2017, CBP/TRS-319-17 <https://d38c6ppuviqmfp.cloudfront.net/documents/CBPMethodsManualMay2017.pdf>
Quality Assurance Project Plan for the Maryland Department of Natural Resources, Chesapeake Bay Shallow Water Quality Monitoring Program, for the period July 1, 2022 - June 30, 2023 <https://eyesonthebay.dnr.maryland.gov/eyesonthebay/documents/SWM_QAPP_2022_2023_Draft_v7.pdf>
Time_Period_of_Content:
Time_Period_Information:
Range_of_Dates/Times:
Beginning_Date: 20220101
Ending_Date: 20221231
Currentness_Reference: Ground condition
Status:
Progress: Complete
Maintenance_and_Update_Frequency: As needed
Spatial_Domain:
Bounding_Coordinates:
West_Bounding_Coordinate: -79.4938
East_Bounding_Coordinate: -75.0405
North_Bounding_Coordinate: 39.7425
South_Bounding_Coordinate: 37.8713
Keywords:
Theme:
Theme_Keyword_Thesaurus:
Global Change Master Directory (GCMD). 2023. GCMD Keywords, Version 15.8 Greenbelt, MD: Earth Science Data and Information System, Earth Science Projects Division, Goddard Space Flight Center (GSFC) National Aeronautics and Space Administration (NASA). URL (GCMD Keyword Forum Page): <https://forum.earthdata.nasa.gov/app.php/tag/GCMD+Keywords>
Theme_Keyword:
Earth Science > Biosphere > Ecosystems > Marine Ecosystems > Estuary
Theme_Keyword:
Earth Science > Biosphere > Ecosystems > Freshwater Ecosystems > Rivers/Streams
Theme_Keyword:
Earth Science > Biosphere > Ecological Dynamics > Ecosystem Functions > Nutrient Cycling
Theme_Keyword:
Earth Science > Biosphere > Ecological Dynamics > Ecosystem Functions > Primary Production
Theme_Keyword:
Earth Science > Terrestrial Hydrosphere > Surface Water > Surface Water Features > Rivers/Streams
Theme_Keyword:
Earth Science > Terrestrial Hydrosphere > Surface Water > Surface Water Processes/Measurements > Water Depth
Theme_Keyword:
Earth Science > Terrestrial Hydrosphere > Water Quality/Water Chemistry > Water Characteristics > Chlorophyll Concentrations
Theme_Keyword:
Earth Science > Terrestrial Hydrosphere > Water Quality/Water Chemistry > Water Characteristics > Conductivity
Theme_Keyword:
Earth Science > Terrestrial Hydrosphere > Water Quality/Water Chemistry > Water Characteristics > Light Transmission
Theme_Keyword:
Earth Science > Terrestrial Hydrosphere > Water Quality/Water Chemistry > Water Characteristics > Nitrogen Compounds
Theme_Keyword:
Earth Science > Terrestrial Hydrosphere > Water Quality/Water Chemistry > Gases > Dissolved Oxygen
Theme_Keyword:
Earth Science > Terrestrial Hydrosphere > Water Quality/Water Chemistry > Water Characteristics > Nutrients
Theme_Keyword:
Earth Science > Terrestrial Hydrosphere > Water Quality/Water Chemistry > Water Characteristics > pH
Theme_Keyword:
Earth Science > Terrestrial Hydrosphere > Water Quality/Water Chemistry > Water Characteristics > Phosphorous Compounds
Theme_Keyword:
Earth Science > Terrestrial Hydrosphere > Water Quality/Water Chemistry > Solids > Suspended Solids
Theme_Keyword:
Earth Science > Terrestrial Hydrosphere > Water Quality/Water Chemistry > Water Characteristics > Turbidity
Theme_Keyword:
Earth Science > Terrestrial Hydrosphere > Water Quality/Water Chemistry > Water Characteristics > Water Temperature
Theme_Keyword:
Earth Science > Terrestrial Hydrosphere > Water Quality/Water Chemistry > Water Characteristics > Saline Concentration
Theme_Keyword: Earth Science > Salinity/Density > Pycnocline
Place:
Place_Keyword_Thesaurus: Producer Defined
Place_Keyword: United States
Place_Keyword: Maryland
Place_Keyword: Chesapeake Bay Watershed
Place_Keyword: Chesapeake Bay
Place_Keyword: Anne Arundel County
Place_Keyword: Baltimore City
Place_Keyword: Baltimore County
Place_Keyword: Charles County
Place_Keyword: Dorchester County
Place_Keyword: Harford County
Place_Keyword: Prince George's County
Place_Keyword: Somerset County
Place_Keyword: St. Mary's County
Place_Keyword: Back River
Place_Keyword: Bush River
Place_Keyword: Fishing Bay
Place_Keyword: Patapsco River
Place_Keyword: Patuxent River
Place_Keyword: Potomac River
Place_Keyword: Susquehanna River
Place_Keyword: Tangier Sound
Place_Keyword: Wicomico River
Temporal:
Temporal_Keyword_Thesaurus: USGS Thesaurus
Temporal_Keyword: autumn
Temporal_Keyword: spring (season)
Temporal_Keyword: summer
Temporal_Keyword: winter
Access_Constraints: None
Use_Constraints:
Acknowledgement of the MD Department of Natural Resources, Resource Assessment Service as a data source would be appreciated in products developed from these data. Please use the following citation: Maryland Department of Natural Resources, Resource Assessment Service. Eyes on the Bay. URL: <http://www.eyesonthebay.net>.
Point_of_Contact:
Contact_Information:
Contact_Person_Primary:
Contact_Person: Mark Trice
Contact_Position: Chief, Water Quality Informatics
Contact_Address:
Address_Type: Mailing Address
Address: MDDNR, 580 Taylor Avenue, D2
City: Annapolis
State_or_Province: MD
Postal_Code: 21401
Contact_Voice_Telephone: 410 260-8630
Contact_Electronic_Mail_Address:
Mark.Trice_nospam_@maryland.gov[Remove _nospam_ for valid email address]
Browse_Graphic:
Browse_Graphic_File_Name:
Browse_Graphic_File_Description:
Map of twenty-one 2022 Continuous Monitoring Stations.
Browse_Graphic_File_Type: JPG
Data_Set_Credit:
Maryland Department of Natural Resources (MDDNR) Resource Assessment Service (RAS) staff collected the majority of samples and processed the data. The Nutrient Analytical Services Laboratory (NASL) at the Chesapeake Biological Laboratory (University of Maryland Center for Environmental Science) analyzed the nutrient, chlorophyll and suspended solids samples.
The project was made possible with funding provided by The State of Maryland, the United States Environmental Protection Agency Chesapeake Bay Program, the National Oceanic and Atmospheric Administration Chesapeake Bay Office and National Estuarine Research Reserve System program, the Oyster Recovery Partnership, the National Aquarium in Baltimore, Maryland Environmental Service, the University of Maryland Center for Environmental Science, and the National Marine Sanctuary Foundation.
Data_Quality_Information:
Attribute_Accuracy:
Attribute_Accuracy_Report:
Quality Assurance/Quality Control: MDDNR followed specific procedures to ensure that the Shallow Water Quality Monitoring Program project design was properly implemented and managed with sufficient accuracy, precision, and detection limits. Accuracy (closeness to the true value) of collected data was controlled and assured by the proper use, calibration and maintenance of both field and laboratory equipment for the measurement of physical and chemical parameters.
The YSI 6600 V2 sondes were configured with the following probes: 6560(conductivity/temperature); 6561(flat glass pH) or 6579(tall pH); 6136(turbidity); 6150(ROX dissolved oxygen); 6025(fluorescence/chlorophyll).
The YSI EXO2 sondes were configured with the following probes: 599870-01(conductivity/temperature) or 599827 (wiped conductivity/temperature); 599702(unguarded pH); 599101-01(turbidity); 599100-01(optical dissolved oxygen); 599103-01(total algal chlorophyll and phycoerythrin).
The YSI EXO1 sondes were configured with the following probes: 599870(conductivity/temperature); 599100-01(optical dissolved oxygen).
Resolution, range and accuracy specifications for the YSI sondes and probes may be obtained from the manufacturer. <https://www.ysi.com/customer-support>
In March 2015, all remaining Series 4a instruments equipped with Standard Clark Polarographic Dissolved Oxygen Sensors were replaced with Series 5 instruments equipped with optical dissolved oxygen sensors (Luminescent Dissolved Oxygen Sensor - LDO). Calibration logs for each instrument list specific replacement dates. Sensors for temperature, specific conductance, pH and depth are identical for Series 4a and 5 instruments.
Procedures used to control and assure the accuracy of field measurements consisted of calibration of field instruments, verification of calibrations, equipment maintenance, and collection of filter blanks. Details of how data acquired with YSI sondes were quality assured and quality controlled may be found in the process description elements in the Lineage portion of this metadata record.
Water quality laboratory analysis results were used to calibrate and cross-check sonde data for accuracy. Daily quality control checks (including the running of blanks and standards) were used to control and assure laboratory accuracy.
Accuracy of Chesapeake Biological Laboratory, Nutrient Analytical Services Laboratory (CBL NASL) laboratory results was also assessed through DNR's participation in the Chesapeake Bay Coordinated Split Sample Program (CSSP), a split sampling program in which five laboratories involved in Chesapeake Bay monitoring analyze the coordinated split samples. CSSP was initiated in June 1989 to establish a measure of comparability between sampling and analytical operations for water quality monitoring throughout the Chesapeake Bay and its tributaries. DNR followed the protocols in the Chesapeake Bay Coordinated Split Sample Program Implementation Guidelines (EPA 1991) and its revisions. Split samples were collected quarterly. Results were analyzed by appropriate statistical methods to determine if results differed significantly among labs. If a difference occurred, discussions began regarding techniques and potential method changes to resolve discrepancies.
Additionally, CBL NASL participated two times per year in the United States Geologic Survey (USGS) reference sample program.
Construction of a Baltimore Gas and Electric (BGE) transmission line in the Bush River 2.25 miles downstream of station XJG7035, which began on 1-Sep-2021, continued in 2022. Removal of existing cables was scheduled to take place between 27-Jun-2022 and the week of 8-Jul-2022 and involved dragging the river bottom during the removal process. This activity may have impacted turbidity within the river during this time. To minimize impact, turbidity curtains were installed and maintained during these activities.
Logical_Consistency_Report:
Two of the attributes in the water quality data set are PARAMETER and MEASUREVALUE. In cases where PARAMETER value is "SIGMA_T" and the MEASUREVALUE in the record is a negative number, the number should be considered unreliable. SIGMA_T values are not measured. SIGMA_T values are derived.
During 2022, at all but one station, water quality monitoring sondes were deployed at a single depth. At the Aquarium East station (XIE7136) sondes were deployed concurrently at two depths: one meter from the surface and 0.3-0.4 meters above the bottom.
Values in the 'LAYER' column of sonde data files may be used to determine the depth at which a sonde was deployed. Sonde data from all 2022 sites, except XCH8085 and XIE7136, list a value of 'BS' ('below surface') in the LAYER column. Depth values for stations with a LAYER value of 'BS' will vary depending on the method of sonde deployment at that station. For station XCH8085, a LAYER column value of 'S' indicates the sonde was deployed at either 1 meter or 3 meters below the surface. For station XIE7136, a LAYER column value of 'B' indicates the sonde was deployed 0.3 meters above the bottom and a LAYER column value of 'S' indicates the sonde was deployed 1 meter below the surface.
Beginning in 2013, data collection was discontinued at station XIE4741 (Masonville Cove) and a new station, XIE4742 (Masonville Cove Pier), was deployed approximately 160 meters west of station XIE4741. Also, beginning in 2019, station XEF3551 (Gooses – Surface) was transitioned into NOAA’s Chesapeake Bay Interpretive Buoy System (CBIBS). In 2021, the bottom sonde at station XEF3551 was also transitioned into NOAA’s CBIBS. Surface and bottom data collected at that station are available through NOAA’s CBIBS website <https://buoybay.noaa.gov/> and deployment information is no longer covered in this metadata record.
In the 2022 sonde data, there are numerous instances of turbidity measurements with negative values. The turbidity probe accuracy is plus or minus 5 Nephelometric Turbidity Units/Formazin Nephelometric Units (NTU/FNU). In cases where turbidity probe post-deployment calibration values were within acceptable limits, negative values greater than or equal to -5.0 NTU/FNU are reported.
During 2022, it was not always possible, for logistical reasons, to replace sondes at all sites every two weeks for stations: XIE4742 (Masonville Cove Pier), XCH8085 (Fishing Bay Profiler – Surface), and XHF0460 (Sandy Point - South Beach), or every two to four weeks for stations: LMN0028 (Little Monie Creek), PXT0455 (Jug Bay), WXT0013 (Iron Pot Landing), MTI0015 (Mataponi), XKH2949 (Havre de Grace), XAI8482 (Daugherty Creek), XBF7904 (St. Georges Creek), XCH3277 (Karen Noonan Center), XCI0132 (Deal Island), XDA8236 (Mallows Bay Buoy), XIE7135 (Aquarium West), XIE7136 (Aquarium East – Surface and Bottom), XIF7918 (Riverside), XJG7035 (Otter Point Creek), XCH5196 (Fishing Bay Downstream), XCH6891 (Fishing Bay Marker Downstream), XDH2399 (Fishing Bay Upstream), and XIE5525 (Middle Branch).
The sonde at station XBF7904 was not exchanged on 20-Jun-2022, 25-Jul-2022, 22-Aug-2022, 26-Sep-2022, and 26-Oct-2022.
The sonde at station XHF0460 was not exchanged on 15-Jul-2022 and 15-Sep-2022.
The sonde at station XCH8085 was not exchanged on 25-May-2022, 28-Jun-2022, 21-Jul-2022, 10-Aug-2022, 1-Sep-2022, and 6-Oct-2022.
On or about 19-Jul-2022, station XCH5196 was moved from the deployment location without the consent of DNR. Unauthorized person(s) relocated the station approximately 1.5 nautical miles south of the original site. The monitoring equipment was removed 27-Jul-2022 and redeployed on 18-Aug-2022 approximately three-fourths nautical mile northwest of the location it was found the prior month ((new coordinates: 38.24097, -76.00115). On 21-Sep-2022, the monitoring equipment at station XCH5196 could not be located by DNR field biologists. A subsequent search on 27-Sep-2022 discovered the monitoring equipment near the original deployment location for station XCH5196. Station XCH5196 was removed for the remainder of the year.
Station XCH6891 was deployed as a replacement to station XCH5196 on 21-Nov-2022.
On or about 25-Dec-2022, station XCH8085 was moved from the deployment location without the consent of DNR. Unauthorized person(s) relocated the station approximately 1.3 nautical miles southeast of the original site (new coordinates: 38.287067, -76.003267) where it remained until the end of the year.
Completeness_Report:
2022 Data from twenty-one continuous monitoring stations are available on-line. <https://eyesonthebay.dnr.maryland.gov/contmon/ContMon.cfm>
The 2022 Continuous Monitoring project dataset includes twelve months of sonde records from the continuous monitoring stations: WXT0013 (Iron Pot Landing), PXT0455 (Jug Bay), LMN0028 (Little Monie Creek), XIE4742 (Masonville Cove Pier), XIE7135 (Aquarium West), and XIE7136 (Aquarium East – Surface and Bottom).
Deployments were for eleven months at stations: MTI0015 (Mataponi) and XJG7035 (Otter Point Creek).
Sondes were deployed ten months at station: XDA8236 (Mallows Bay Buoy).
Sonde data were collected for nine months at stations: XCH3277 (Karen Noonan Center), XCI0132 (Deal Island), XAI8482 (Daugherty Creek), XHF0460 (Sandy Point - South Beach), and XDH2399 (Fishing Bay Upstream).
Eight month deployments occurred at stations: XIF7918 (Riverside) and XCH8085 (Fishing Bay Profiler – Surface).
Deployments at stations: XBF7904 (St Georges Creek), XKH2949 (Havre de Grace), and XCH5196 (Fishing Bay Downstream) lasted six months.
Sondes were deployed four months at station: XIE5525 (Middle Branch).
Sonde data were collected for two months at station: XCH6891 (Fishing Bay Marker Downstream).
In 2022, the full suite of nutrient samples was not collected at any station. A sub-set of nutrients (Volatile Suspended Solids, Ammonium, Orthophosphate, Nitrite plus Nitrate, Total Dissolved Nitrogen (TDN), and Total Dissolved Phosphorus (TDP) were collected at stations: XJG7035 (Otter Point Creek), PXT0455 (Jug Bay), MTI0015 (Mataponi), WXT0013 (Iron Pot Landing), LMN0028 (Little Monie Creek), and XDA8236 (Mallows Bay Buoy). Total Suspended Solids, chlorophyll, and pheophytin were collected at all stations except stations XIE7135 (Aquarium West), XIE7136 (Aquarium East - Bottom and Surface), XIE5525 (Middle Branch), XDH2399 (Fishing Bay Upstream), XCH5196 (Fishing Bay Downstream), XCH6891 (Fishing Bay Marker Downstream), and XCH8085 (Fishing Bay Profiler – Surface). No samples were collected by DNR at these seven stations.
The user may discover a few interruptions in sonde datasets. In most cases, these interruptions were related to short-term problems with sonde operation.
There were gaps in the sonde data for the following reasons.
Station XJG7035 (Otter Point Creek) was not deployed between 6-Jan-2022 and 3-Mar-2022 and was removed from service on 21-Dec-2022 due to concerns about ice and low temperatures.
Station MTI0015 (Mataponi) was not deployed between 10-Jan-2022 and 9-Mar-2022 and was removed from service on 21-Dec-2022 due to concerns about ice and low temperatures.
Station XKH2949 (Havre de Grace) was not deployed until 16-Jun-2022 due to personnel constraints and staffing shortages.
Station XBF7904 (St Georges Creek) was not deployed until 6-Jun-2022 due to personnel constraints and staffing shortages.
Station XIE5525 (Middle Branch) was not deployed until 8-Sep-2022 because funding and equipment for this station did not become available until this time.
Station XDA8236 (Mallows Bay Buoy) was not deployed until 28-Mar-2022 and was removed from service on 22-Dec-2022 due to concerns about ice and low temperature. Station XDA8236 is also missing data from 15-Aug-2022 to 18-Aug-2022 due to an equipment malfunction.
Station XIE4742 (Masonville Cove Pier) is missing data from 20-Feb-2022 to 15-Mar-2022 and from 17-Mar-2022 to 7-Apr-2022 due to equipment malfunctions. Station XIE4742 is also missing data from 25-Dec-2022 to 31-Dec-2022 due to an equipment power failure.
Station XIE7136 (Aquarium East – Surface) is missing data from 17-Apr-2022 to 19-Apr-2022 and from 28-Apr-2022 to 5-May-2022 due to equipment power failures.
Station XCH3277 (Karen Noonan Center) is missing data from 22-May-2022 to 23-May-2022 due to an equipment malfunction.
Station XHF0460 (Sandy Point - South Beach) is missing data from 22-Jul-2022 to 27-Jul-2022 due to an equipment malfunction.
Station XCH5196 (Fishing Bay Downstream) is missing data from 27-Jul-2022 to 18-Aug-2022 because the sonde was not deployed.
Station XCI0132 (Deal Island) is missing data from 4-Aug-2022 to 17-Aug-2022 due to an equipment configuration error and power failure.
Station XCH8085 (Fishing Bay Profiler – Surface) is missing data from 25-Apr-2022 to 11-May-2022, 2-Aug-2022 to 18-Aug-2022, 3-Nov-2022 to 5-Nov-2022, 9-Nov-2022 to 11-Nov-2022, and from 22-Dec-2022 to 24-Dec-2022 due to equipment malfunctions.
Station LMN0028 (Little Monie Creek) is missing data from 4-Aug-2022 to 31-Aug-2022 due to an equipment configuration error and power failure. Station LMN0028 is also missing data from 10-Oct-2022 to 26-Oct-2022 due to an equipment power failure.
Station XAI8482 (Daugherty Creek) is missing data from 5-Aug-2022 to 17-Aug-2022 due to and equipment power failure.
Station XDH2399 (Fishing Bay Upstream) is missing data from 26-Jun-2022 to 7-Jul-2022 due to an equipment power failure.
On a few occasions, due to extreme low tide conditions, sondes were not submerged. These data are not included in the published dataset.
All other missing sonde attribute values were removed during the quality control process because the data were determined to be unreliable.
Lineage:
Process_Step:
Process_Description:
SONDE CALIBRATION and POST-CALIBRATION
The Yellow Springs Instrument (YSI) 6600 V2, EXO2, and EXO1 data sondes were maintained and calibrated before and after each deployment in accordance with YSI recommendations. <https://www.ysi.com/customer-support>
FIELD MEASUREMENTS AND SAMPLING
SONDES:
The continuous monitoring sensors at the sites recorded seven water quality parameters every 15 minutes, except at station XCH8085. The surface monitor at station XCH8085 sampled parameters at 60-minute intervals for all deployments. Data were uploaded to DNR's web site <http://www.eyesonthebay.net> shortly after retrieval.
At most sites, seven water quality parameters were measured continuously: water temperature, specific conductance (used to derive salinity values), dissolved oxygen, oxygen percent saturation, turbidity (NTU/FNU), fluorescence (used to estimate chlorophyll a), and pH. At three sites within Fishing Bay, a subset of parameters were measured: water temperature, specific conductance, dissolved oxygen concentration, and oxygen percent saturation. Sondes deployed at fixed depths also measured water depth.
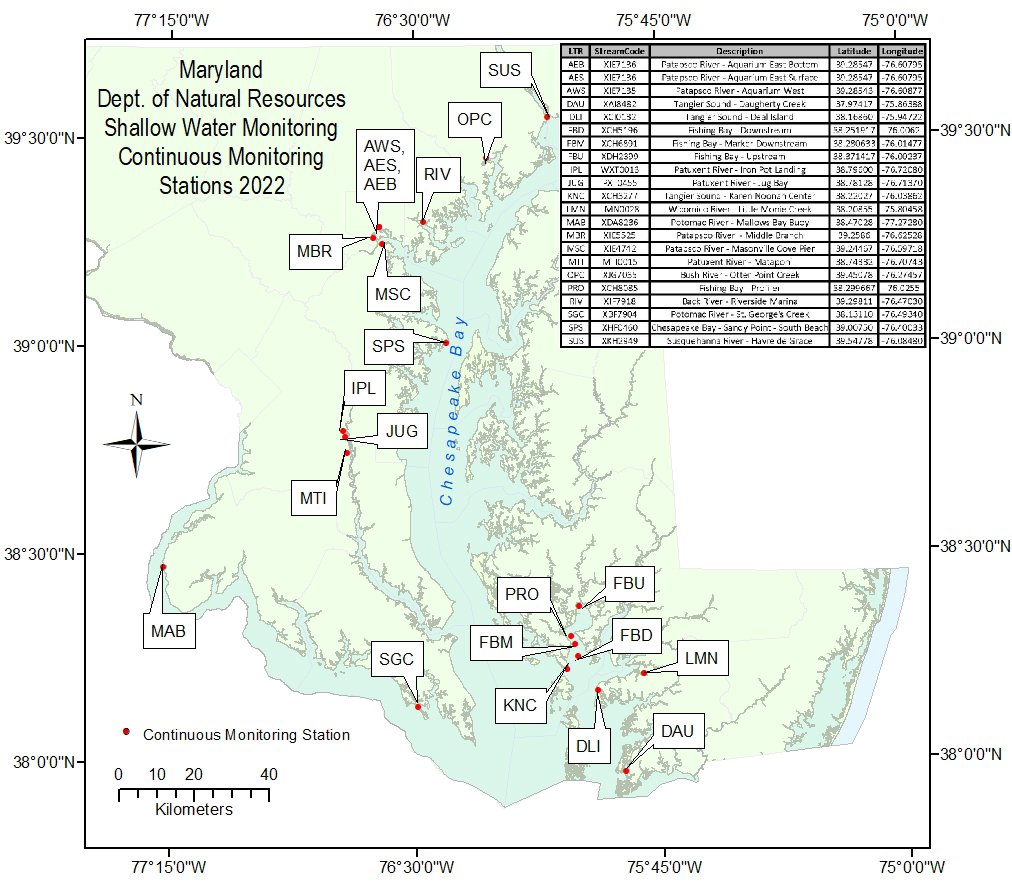
Three monitoring stations were equipped with a YSI 6600 V2 sonde. These stations were: XIE4742 (Masonville Cove Pier), XCH8085 (Fishing Bay Profiler – Surface), and XHF0460 (Sandy Point - South Beach). Three other monitoring stations deployed within Fishing Bay were equipped with a YSI EXO1 sonde. These stations were: XCH5196 (Fishing Bay Downstream), XCH6891 (Fishing Bay Marker Downstream), and XDH2399 (Fishing Bay Upstream). The following fifteen stations were equipped with a YSI EXO2 sonde: LMN0028 (Little Monie Creek), XIE7135 (Aquarium West), XIE7136 (Aquarium East – Surface and Bottom), XIE5525 (Middle Branch), XIF7918 (Riverside), XBF7904 (St. George’s Creek), XCH3277 (Karen Noonan Center), XCI0132 (Deal Island), XAI8482 (Daugherty Creek), XDA8236 (Mallows Bay Buoy), PXT0455 (Jug Bay), WXT0013 (Iron Pot Landing), MTI0015 (Mataponi), XKH2949 (Havre de Grace), and XJG7035 (Otter Point Creek). All three types of sondes logged data onto an internal memory, where it was stored until retrieval. Eight stations were equipped with cellular telemetry units, which allowed data to be transmitted hourly to a server computer at DNR. Some sondes were deployed inside vertically-oriented PVC pipes with several two-inch holes drilled along their length to allow for water exchange. Depending on location, these sondes were either suspended from a float 1.0 meters below surface or fixed 0.3 meters or 0.5 meters above bottom resting on a stop bolt. Some EXO1 and EXO2 sondes were deployed inside a crab pot-like structure that rested on the bottom and suspended the instrument 0.3 meters off bottom in a horizontal PVC tube tethered to a pier with a cable.
Sondes at the following stations were deployed at a fixed depth of 0.3 meters above the bottom: LMN0028 (Little Monie Creek), MTI0015 (Mataponi), PXT0455 (Jug Bay), WXT0013 (Iron Pot Landing), XJG7035 (Otter Point Creek), XKH2949 (Havre de Grace), XIF7918 (Riverside), XHF0460 (Sandy Point - South Beach), XIE7136 (Aquarium East - Bottom), XCH3277 (Karen Noonan Center), XCI0132 (Deal Island), XAI8482 (Daugherty Creek), XCH5196 (Fishing Bay Downstream), XCH6891 (Fishing Bay Marker Downstream), and XDH2399 (Fishing Bay Upstream).
Sondes at station XBF7904 (St Georges Creek) were deployed at a fixed depth of 0.5 meters above the bottom.
Sondes at station XIE5525 (Middle Branch) were deployed at a fixed depth of 0.8 meters above the bottom.
Sondes at stations XIE7135 (Aquarium West), XIE7136 (Aquarium East – Surface), XIE4742 (Masonville Cove Pier) and XDA8236 (Mallows Bay Buoy) were deployed suspended from buoys or floats at a depth of 1.0 meter below the surface.
Sondes at station XCH8085 (Fishing Bay Profiler – Surface) were deployed suspended at a depth of 1.0 meter below the surface between 11-May-2022 and 17-Nov-2022. On 17-Nov-2022, the deployment depth was changed to 3 meters for the remainder of the year to better monitor water quality conditions in deeper waters.
Note that sondes were deployed concurrently at two depths at station: XIE7136.
At station XDA8236 (Mallows Bay Buoy) a weather station was deployed in conjunction with the water quality monitoring sondes that provided real-time data on air temperature, barometric pressure, and wind speed and direction.
WATER QUALITY CALIBRATION SAMPLES:
Every time sondes were exchanged at each Continuous Monitoring station, "grab" water quality samples were collected at 1.0 meter depth, or at deployment depth for stations deployed at a fixed depth above the bottom, using a horizontal "Alpha" water sampler. At the time the water was collected, a Hydrolab or EXO sonde measurement was taken at 1.0 meter or at deployment depth. Note that no samples were collected by DNR at stations XIE7135, XIE7136, XIE5525, XCH5196, XCH6891, XDH2399, XCH8085.
Numbered two-quart bottles were triple-rinsed and filled with water for "whole" and "filtered" nutrient and chlorophyll samples. (As noted previously, full suites of nutrient samples were not collected at all stations).
Nutrient, pigment and suspended-solid water samples were filtered on station or shortly thereafter. Sample waters and filters were placed on ice immediately after filtration.
Particulate samples included: Chlorophyll, Pheophytin, Particulate Carbon, Particulate Nitrogen (PN), Particulate Phosphorus (PP), Total Suspended Solids (TSS) and Volatile Suspended Solids (VSS).
Filtrate collected from TSS/VSS or PP/PIP filtrations was used for dissolved nutrient samples. Total Dissolved Nitrogen (TDN) and Total Dissolved Phosphorus (TDP), Nitrite plus Nitrate, Ammonium, and Orthophosphate.
HYDROLAB/EXO PROFILE:
The first reading of the Hydrolab or EXO water column profile at each station was recorded at the same time the water quality "grab" sample was collected. After the 1.0 meter depth record was logged, the sonde was lowered to the bottom. A reading was taken at 0.3 meters above the bottom. The sonde was raised and measurements were recorded at 0.5 meter or 1.0 meter increments until it reached the surface. (In cases where station depth was greater than 3 meters, the sonde was raised in 1 meter increments).
SECCHI DEPTH:
Secchi disk depth was measured each time sondes were exchanged. Readings with the Secchi disk were made in-situ without the aid of sunglasses. The Secchi disk was lowered into the water, on the shady side of the boat or pier. The depth at which the disk was no longer visible was recorded. The time at which the reading was taken was noted. This facilitated later matching of Secchi depth readings with transmissometer and turbidity data.
PAR MEASUREMENT:
Underwater Photosynthetically Active Radiation (PAR, 400-700nm)
When meters were exchanged at a site, down-welling light penetrating the water column (PAR) was measured underwater at several depths to calculate the light attenuation coefficient, Kd. Simultaneous surface and submersed PAR intensity measurements were taken to account for variability in incident surface irradiance due to changes in cloud cover. Data collected from this procedure were used to estimate the depth of the photic zone.
The equipment used was manufactured by LI-COR, Inc. and consisted of a LI-192SA, flat cosine Underwater Quantum Sensor, a LI-190R-BNC-2 air (deck) reference sensor and a Data Logger (LI-1400 or LI-1500).
Surface and underwater readings were recorded simultaneously. Readings were allowed to stabilize before being recorded. If the station depth was less than 3 meters, readings were taken at 0.1 meter and then at 0.25 meter intervals, until 10% of the 0.1 meter reading was reached. If the station depth was greater than 3 meters, a reading was taken at 0.1 meter and at 0.5 meter intervals until 10% of the 0.1 meter reading was reached.
PAR readings had also been collected at 15-minute intervals during deployment dates at station XBM8828 (Public Landing) between 2005 and 2012. All 2013 readings were considered invalid, however, due to equipment failure and the PAR sensor has not been deployed at any station since 2013.
SONDE DATA CHECKS
At three stations that utilized 6600 V2 data loggers, the continuous monitoring sondes were retrieved, calibrated and replaced bi-weekly during deployment. At eighteen stations, data loggers equipped with more advanced monitoring technology that allows for longer deployments were exchanged every two to four weeks. Data loggers deployed from November to March were exchanged monthly because less biofouling, which may compromise data integrity, occurs during cold weather months. At each deployment, sondes were replaced with clean, recalibrated units and data from the data loggers were downloaded to a computer.
In the field, before an instrument was replaced, field staff allowed both the new (freshly calibrated) sonde and the old (deployed) sonde to log two readings (fifteen minutes apart at most stations) side by side at the same depth. At all of the stations, for one of the simultaneous readings, data were recorded from a discrete instrument (a Hydrolab or EXO sonde). This three-way comparison assured that the "new" and "old" sondes were both reading each parameter within a certain tolerance. The Hydrolab or EXO reading was used as a "double-check," and since it was a discrete reading, it allowed staff to watch the display and note whether the parameters were fluctuating or stable.
EcoWatch(TM) software (a YSI product) was used to calibrate the YSI 6600 V2 instruments, as well as to upload and view data collected. KOR(TM) software (a YSI product) was used to calibrate the EXO1 and EXO2 instruments, as well as to upload and view data collected. Data downloaded from the sonde were subjected to quality assurance/quality control checks to ensure that values outside the range of possibility were not displayed on the DNR web site <http://www.eyesonthebay.net>.
Data were evaluated using both three-way in-situ comparison results and data from sonde calibrations. The comparison tolerances were as follows for both pre- and post-calibration and in-situ comparisons: Temperature (deg C) +- 0.2; Specific Conductance (uM/cm) +- 5%; Dissolved Oxygen (mg/l) +- 0.5 mg/l; pH +- 0.2; Turbidity (NTU/FNU) +- 5% or 5.0 NTU/FNU (whichever is greater); Chlorophyll (ug/l) +- 5% or 5.0 ug/l (whichever is greater).
Excessive drift between pre- and post- calibration values of sonde probes, variance from in-situ measurements or probe failures caused data to be flagged. When post-calibration drift exceeded the limits stated above in both the post-calibration and the in-situ comparables, suspect data were masked within the data set with an error code (see Quality Assurance Project Plan for list of error codes).
SONDE FILE POST-PROCESSING:
Each "raw" .csv file of sonde data was post-processed using an Excel(TM) macro. The file was opened and renamed. Rows of data acquired before and after deployment were deleted. Records (if any) were also deleted if instrument error codes indicated erroneous data. The macro rearranged columns and inserted error-tracking columns and headings. Macro statements flagged negative values, missing values and highlighted values outside each parameter's normal range. The macro also returned a report summarizing range exceedances. Event and instrument information was appended to each record.
Flagged values were evaluated. Common anomalies included spikes in fluorescence and turbidity, dips in specific conductance, and extremely high dissolved oxygen readings. Instrument post-calibration results, in-situ comparisons with Hydrolab or EXO instruments, LI-COR readings, historical data from nearby locations, and survey crew remarks were used to determine whether sensor values were acceptable.
In cases where data were determined to be unreliable, the reason(s) were documented with error codes and comments. Unreliable data were masked. No data were discarded. Only data considered reliable were published in reports.
Field biologists and data analysts reviewed continuous monitoring data weekly. If a problem was identified, a field team member was dispatched to replace the instrument as soon as possible.
VERIFICATION AND DATA MANAGEMENT
At the end of the monitoring season, DNR data analysts and field biologists conducted additional data QA/QC procedures. All of the data were plotted and outliers and anomalous values were thoroughly researched. Staff compared unusual values to historic values from the site and values from nearby sites in the Bay. Weather events were considered, event logs were reviewed, and field staff members were consulted regarding possible legitimate causes for the values. In cases where values were not considered legitimate, error codes were assigned. All data were retained in the archive data set. After field staff and the Quality Assurance Officer reviewed error flags, the values were masked within the published dataset.
Process_Date: Unknown
Process_Contact:
Contact_Information:
Contact_Person_Primary:
Contact_Person: Kristen Heyer
Contact_Position: Program Manager, Water Quality Monitoring, DNR
Contact_Address:
Address_Type: mailing and physical
Address: 1919 Lincoln Drive
City: Annapolis
State_or_Province: Maryland
Postal_Code: 21401
Country: USA
Contact_Voice_Telephone: 410 263-3369
Contact_Electronic_Mail_Address:
Kristen.Heyer_nospam_@maryland.gov[Remove _nospam_ for valid email address]
Process_Step:
Process_Description:
LABORATORY ANALYSIS - CBL University of Maryland Center for Environmental Science's Chesapeake Biological Laboratory (CBL), Nutrient Analytical Services Laboratory analyzed total dissolved nitrogen, particulate nitrogen, nitrite, nitrite + nitrate, ammonium, total dissolved phosphorus, particulate phosphorus, particulate inorganic phosphorus, orthophosphate, dissolved organic carbon, particulate carbon, total suspended solids, volatile suspended solids, chlorophyll, and pheophytin.
Note that in 2022, the full suite of nutrients was not collected at any station. A subset of nutrients (Volatile Suspended Solids, Ammonium, Orthophosphate, Nitrite plus Nitrate, Total Dissolved Nitrogen, and Total Dissolved Phosphorus) was collected at stations XJG7035 (Otter Point Creek), PXT0455 (Jug Bay), MTI0015 (Mataponi), WXT0013 (Iron Pot Landing), LMN0028 (Little Monie Creek), and XDA8236 (Mallows Bay Buoy). Total Suspended Solids, chlorophyll, and pheophytin were collected at all stations except stations XIE7135 (Aquarium West), XIE7136 (Aquarium East - Bottom and Surface), XIE5525 (Middle Branch), XCH8085 (Fishing Bay Profiler – Surface), XCH5196 (Fishing Bay Downstream), XCH6891 (Fishing Bay Marker Downstream), and XDH2399 (Fishing Bay Upstream). No samples were collected by DNR at these seven stations.
During the years 2008-2011, Shallow Water Monitoring silicate samples were collected and analyzed at four Maryland Coastal Bays stations: XDM4486 (Bishopville Prong), XDN6921 (Grey's Creek), NPC0012 (Newport Creek) and XBM8828 (Public Landing). Beginning in 2012, silicate samples were no longer collected at these four Coastal Bays stations or any other continuous monitoring stations.
Further information about laboratory analytical procedures may be obtained from the "Process_Contact".
Process_Date: Unknown
Process_Contact:
Contact_Information:
Contact_Person_Primary:
Contact_Person: Jerry Frank
Contact_Position: Manager, Nutrient Analytical Services Laboratory
Contact_Address:
Address_Type: mailing and physical
Address: Chesapeake Biological Laboratory, 146 Williams St; P.O. Box 38
City: Solomons
State_or_Province: Maryland
Postal_Code: 20688
Country: USA
Contact_Voice_Telephone: 410 326-7252
Contact_Electronic_Mail_Address:
frank_nospam_@umces.edu[Remove _nospam_ for valid email address]
Spatial_Data_Organization_Information:
Indirect_Spatial_Reference:
Back River, Bush River, Chesapeake Bay, Fishing Bay, Patapsco River, Patuxent River, Potomac River, Susquehanna River, Tangier Sound, Wicomico River, Maryland, USA
Direct_Spatial_Reference_Method: Point
Spatial_Reference_Information:
Horizontal_Coordinate_System_Definition:
Geographic:
Latitude_Resolution: 0.0001
Longitude_Resolution: 0.0001
Geographic_Coordinate_Units: Decimal degrees
Geodetic_Model:
Horizontal_Datum_Name: North American Datum of 1983
Ellipsoid_Name: Geodetic Reference System 80
Semi-major_Axis: 6378137
Denominator_of_Flattening_Ratio: 298.257
Entity_and_Attribute_Information:
Overview_Description:
Entity_and_Attribute_Overview:
This metadata record is a description of a continuous monitoring project. Project data are an aggregation of data collected at twenty-one Maryland stations during 2022.
The data are contained in six related entities (tables): Station_Information, Monitoring_Event_Data, Water_Quality_Data, Light_Attenuation_Data, Optical_Density_Data, and CMON_DATA. Each table contains attributes (fields).
The entity Station_Information is comprised of the attributes: Station, StationDescription, CBSeg2003, CBSeg2003Description, CBSegmentShed2009, CBSegmentShed2009Description, HUC8, HUC12, FIPS, State, CountyCity, USGSGage, FallLine, Latitude, Longitude, UTMX, UTMY and LLDatum.
The entity Monitoring_Event_Data is comprised of the attributes: HUC8, HUC12, FIPS, CBSeg2003, SegmentShed2009, MonitoringStation, EventId, Cruise, Program, Project, Agency, Source, Station, SampleDate, SampleTime, TotalDepth, UpperPycnocline, LowerPycnocline, FieldActivityEventType, FieldActivityRemark, WindSpeed, WindDirection, PrecipType, TideStage, WaveHeight, CloudCover, Pressure, GaugeHeight, FlowStage, Details, Latitude, Longitude, and TierLevel.
The entity Water_Quality_Data is comprised of the attributes: HUC8, HUC12, FIPS, CBSeg2003, SegmentShed2009, MonitoringStation, EventId, Cruise, Program, Project, Agency, Source, Station, SampleDate, SampleTime, TotalDepth, UpperPycnocline, LowerPycnocline, Depth, Layer, SampleType, SampleReplicateType, Parameter, Qualifier, MeasureValue, Unit, Method, Lab, Problem, PrecisionPC, BiasPC, Details, Latitude, Longitude, and TierLevel.
The entity Light_Attenuation_Data is comprised of the attributes: HUC8, HUC12, FIPS, CBSeg2003, SegmentShed2009, MonitoringStation, EventId, Cruise, Program, Project, Agency, Source, Station, SampleDate, SampleTime, TotalDepth, UpperPycnocline, LowerPycnocline, Depth, Layer, SampleType, SampleReplicateType, Parameter, Qualifier, MeasureValue, Unit, Method, Lab, Problem, PrecisionPC, BiasPC, Details, Latitude, Longitude, and TierLevel.
The entity Optical_Density_Data is comprised of the attributes: HUC8, HUC12, FIPS, CBSeg2003, SegmentShed2009, MonitoringStation, EventId, Cruise, Program, Project, Agency, Source, Station, SampleDate, SampleTime, TotalDepth, UpperPycnocline, LowerPycnocline, Depth, Layer, SampleType, SampleReplicateType, Parameter, Qualifier, MeasureValue, Unit, Method, Lab, Problem, PrecisionPC, BiasPC, Details, Latitude, Longitude, and TierLevel.
The entity CMON_DATA is comprised of the attributes: Sample_date, Sample_Time, DateTime, Station, Layer, SampleDepth_m, Salinity_ppt, pH, DO_mg/L, DO_pctSat, Turb_NTU, Chl_ug/L, T_Fahr, Temp_C.
Entity_and_Attribute_Detail_Citation:
Water Quality Database - Database Design and Data Dictionary Prepared For: U.S. Environmental Protection Agency, Region III, Chesapeake Bay Program Office, January 2004. <https://d18lev1ok5leia.cloudfront.net/chesapeakebay/documents/cbwqdb2004_rb.pdf>
Guide to Using Chesapeake Bay Program Water Quality Monitoring Data, EPA 903-R-12-001, February 2012, CBP/TRS 304-12 <https://d18lev1ok5leia.cloudfront.net/chesapeakebay/documents/wq_data_userguide_10feb12_mod.pdf>
Methods and Quality Assurance for Chesapeake Bay Water Quality Monitoring Programs, May 2017, CBP/TRS-319-17 <https://d38c6ppuviqmfp.cloudfront.net/documents/CBPMethodsManualMay2017.pdf>
Quality Assurance Project Plan for the Maryland Department of Natural Resources, Chesapeake Bay Shallow Water Quality Monitoring Program, for the period July 1, 2022 - June 30, 2023. <https://eyesonthebay.dnr.maryland.gov/eyesonthebay/documents/SWM_QAPP_2022_2023_Draft_v7.pdf>
Distribution_Information:
Distributor:
Contact_Information:
Contact_Person_Primary:
Contact_Person: Michael Mallonee
Contact_Position: Water Quality Database Manager
Contact_Address:
Address_Type: mailing
Address: 1750 Forest Drive, Suite 130
City: Annapolis
State_or_Province: Maryland
Postal_Code: 21401
Contact_Voice_Telephone: 410-267-5785
Contact_Electronic_Mail_Address:
mmallone@_no_spam_chesapeakebay.net[Remove _nospam_ for valid email address]
Resource_Description: Downloadable data
Distribution_Liability:
None of the Chesapeake Bay Program partners or any of their employees, contractors, or subcontractors makes any warranty, expressed or implied, nor assumes any legal liability or responsibility for the accuracy, completeness, or usefulness of any information or data contained within the web site. Reference to any specific commercial products, processes, or services or the use of any trade, firm, or corporation name is for the information and convenience of the public and does not constitute endorsement, recommendation or favoring by the Chesapeake Bay Program partners.
Standard_Order_Process:
Digital_Form:
Digital_Transfer_Information:
Format_Name: ASCII file, formatted for text attributes, declared format
Format_Information_Content:
Station Information data, Monitoring Event data, Water Quality Data, Light Attenuation data and Optical Density data
File_Decompression_Technique: No compression applied
Transfer_Size: 2.2
Digital_Transfer_Option:
Online_Option:
Computer_Contact_Information: Access_Instructions:
Station Information, Monitoring Event, Water Quality, Light Attenuation and Optical Density data are available through the Chesapeake Bay Program CIMS data hub. Select Water Quality Database (1984-Present). Access the data by following web site (see network resource name) instructions.
Digital_Form:
Digital_Transfer_Information:
Format_Name: ASCII file, formatted for text attributes, declared format
Format_Information_Content: Continuous monitoring sonde data
File_Decompression_Technique: No compression applied
Transfer_Size: 100
Digital_Transfer_Option:
Online_Option:
Computer_Contact_Information:
Network_Address:
Access_Instructions:
CMON data (sonde data) for 2022 are available through the Continuous Monitoring Charts and Data Download page of the Eyes on the Bay website. Access the sonde data by following the web site (see network resource name) instructions. Select station and specify dates. Station record counts range from 3,895 to 35,040. Depending on connection speed, downloads may take a considerable amount of time. Downloading partial record sets will proceed more quickly.
Fees: None
Metadata_Reference_Information:
Metadata_Date: 20230613
Metadata_Contact:
Contact_Information:
Contact_Person_Primary:
Contact_Person: Brian Smith
Contact_Address:
Address_Type: Mailing and physical address
Address: MDDNR, 580 Taylor Ave, D-2
City: Annapolis
State_or_Province: MD
Postal_Code: 21401
Contact_Voice_Telephone: (410) 260-8630
Contact_Electronic_Mail_Address:
brianr.smith_nospam_@maryland.gov[Remove _nospam_ for valid email address]
Metadata_Standard_Name: Content Standards for Digital Geospatial Metadata
Metadata_Standard_Version: FGDC-STD-001-1998

Generated by mp version 2.9.52 on Tue Jun 13 13:07:59 2023