 Print This Page
|
Print This Page |
Spatially Intensive Monitoring Data Used to Target Restoration Sites for Submerged
Aquatic Vegetation
Submerged aquatic vegetation (SAV) is recognized an important habitat for a
variety of aquatic organisms and contributes to produce a healthier aquatic
ecosystem. In a continuing effort to restore these vital habitats, Maryland
DNR is using new monitoring technologies to improve the delineation of possible
successful SAV restoration sites.
The Tidewater Ecosystem Assessment Division of Maryland DNR has been developing an SAV Restoration Targeting System that identifies poor, marginal, fair, and good sites for possible replanting or seeding of SAV (Figure 1). The system uses data such as historical SAV distribution, water depth, areas open to hydraulic clamming, and water clarity to rank or exclude areas for possible restoration. The water clarity component is obtained from water quality monitoring data taken by DNR.
Traditional monitoring at fixed stations, which is useful for observing long-term trends in water quality, does not provide the spatial resolution needed to produce accurate predictions of water clarity for SAV restoration. New monitoring technologies however, such as those used in our spatially intensive monitoring program (link), provide enhanced resolution data valuable to the prediction of light availability for SAV.
As an example, Figure 2 shows the areas that pass the Percent Light in Water (PLW) requirement for SAV at bottom depths of 0.5 meters and 1.0 meters using data from two fixed stations. PLW is a measure of water clarity. Figure 3 shows the same parameters, calculated from the spatially intensive monitoring data. The spatially intensive monitoring data more finely delineates the areas of good water clarity and predictions from this model match closely to surveys of existing SAV coverage (Figure 4).
In the end, the spatially intensive monitoring data will help us to better target areas for successful SAV restoration, and ultimately save time and money in the restoration process.
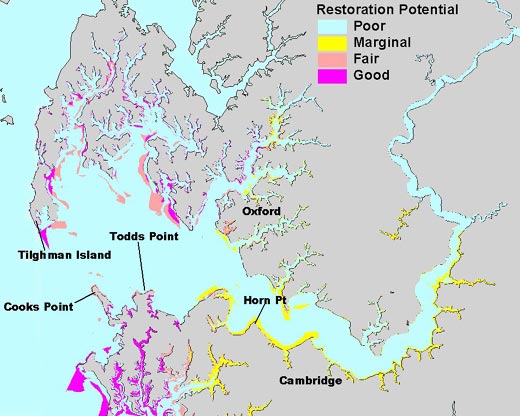
Figure 1.
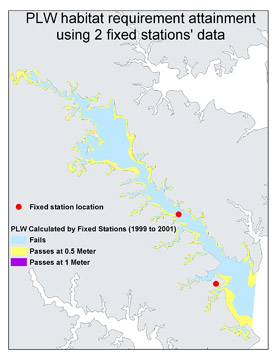
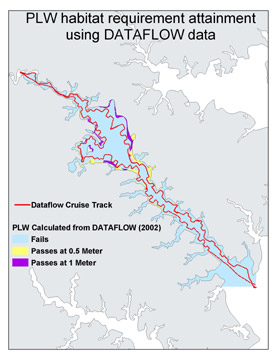
Figure 2. Figure
3.
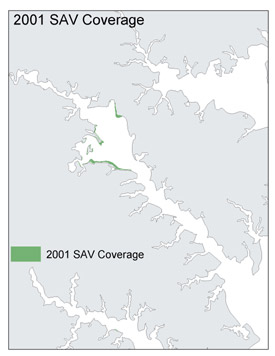
Figure 4.