 Print This Page
|
Print This Page |
2006 Continuous Monitoring Synopsis
The 2006 sampling season was a year of extreme contrasts starting with the driest March on record, a large storm event at the end of June and then Tropical Storm Ernesto at the beginning of September (Read about these events here and here). As seen in figure 1, the storm events resulted in a decrease in dissolved oxygen due to the increase in nutrients flushed into the Bay leading to algal blooms. These algal blooms consume the excess nutrients and start to die leading to bacterial decomposition and the reduction of dissolved oxygen in the water column. However, in looking at water quality for the whole of 2006 the effects of the early drought coupled with the later rain events tended to cancel themselves out resulting in a rather average year (figures 3-6).
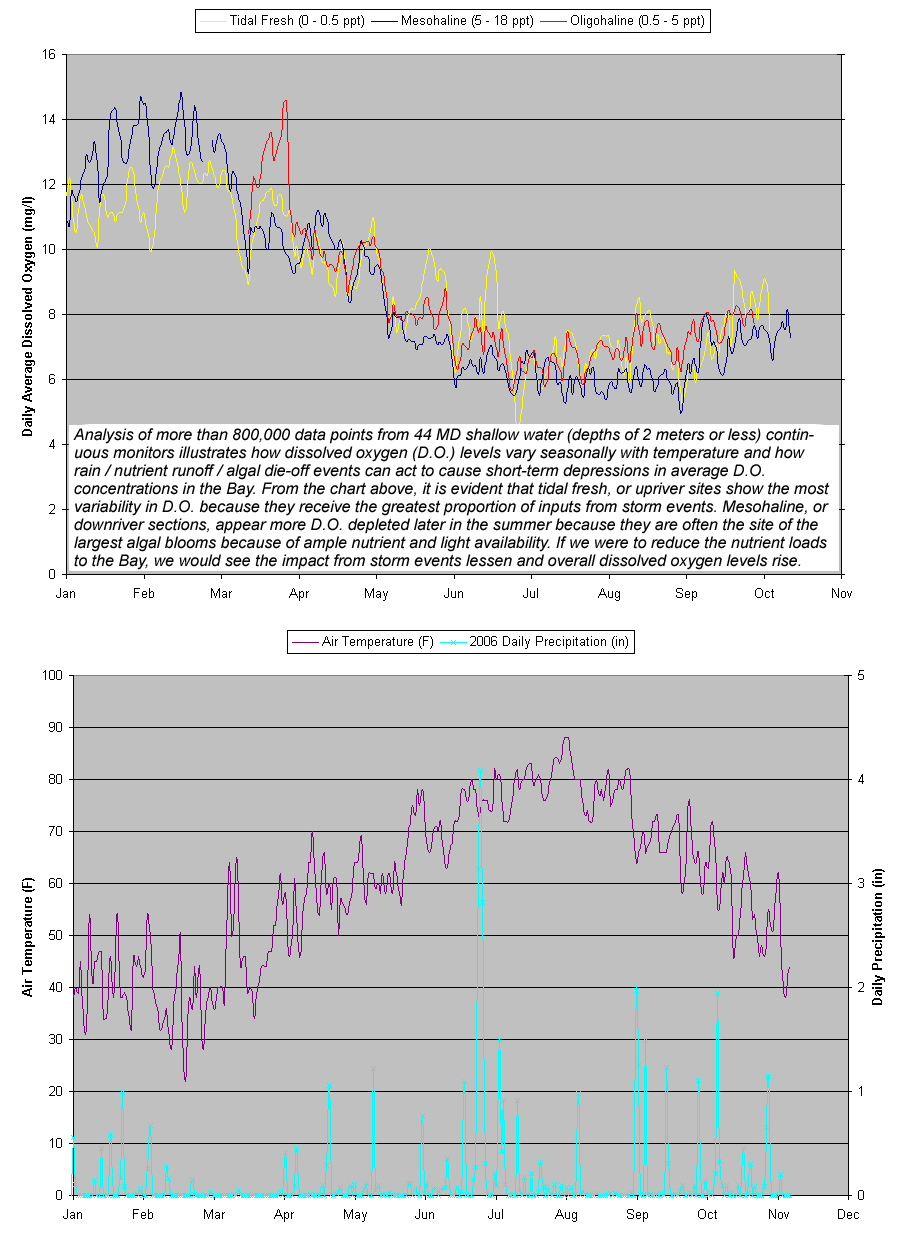
Figure 1.Daily dissolved oxygen levels along with air temperature and precipitation for 44 Maryland Continuous Monitoring stations.
Location |
Station Name |
Start Date |
End Date |
| Lauderick Creek | XJG4337 | 3/28/2006 |
9/26/2006 |
| Otter Point Creek | XJG7035 | 3/14/2006 |
9/11/2006 |
| Sandy Point East | XHF0561 | 3/24/2006 |
10/10/2006 |
| Sandy Point South | XHF0460 | 3/24/2006 |
10/10/2006 |
| Mulberry Point | XFG5054 | 4/4/2006 |
10/3/2006 |
| Horn Point Lab | XEH5622 | 6/1/2006 |
10/5/2006 |
| Jamaica Point | XEI7405 | 4/6/2006 |
10/5/2006 |
| Emory Creek | XHH5046 | 1/1/2006 |
6/22/2006 |
| Possum Point - Surface | XHH4931 | 6/22/2006 |
10/12/2006 |
| Sycamore Point | XHH3851 | 1/1/2006 |
9/14/2006 |
| The Sill Surface | XHH4916 | 6/22/2006 |
9/14/2006 |
| Rolph's Wharf | XIH0077 | 3/30/2006 |
9/28/2006 |
| Deep Landing | CHE0348 | 4/13/2006 |
9/28/2006 |
| CBEC | XGG6667 | 5/4/2006 |
10/10/2006 |
| Hambleton Point | XFG9164 | 3/23/2006 |
9/19/2006 |
| Kent Point | XGF0681 | 3/23/2006 |
9/19/2006 |
| Casson Point | XEG2646 | 3/23/2006 |
10/5/2006 |
| Gary's Creek | XEG4991 | 3/23/2006 |
10/5/2006 |
| High Banks | CHO0417 | 4/10/2006 |
10/5/2006 |
| Fort McHenry | XIE5748 | 4/11/2006 |
9/26/2006 |
| Pin Oak | XDE4587 | 4/5/2006 |
10/4/2006 |
| Iron Pot Landing | WXT0013 | 1/1/2006 |
9/19/2006 |
| Jug Bay | PXT0455 | 1/1/2006 |
9/8/2006 |
| Mataponi | MTI0015 | 1/4/2006 |
9/19/2006 |
| Breton Bay | XCD5599 | 5/28/2006 |
6/1/2006 |
| Piney Point | XBE8396 | 4/10/2006 |
10/3/2006 |
| Pope's Creek | XDC3807 | 4/19/2006 |
10/4/2006 |
| St George's Creek | XBF7904 | 4/25/2006 |
10/3/2006 |
| Swan Point | XCC8346 | 4/5/2006 |
10/4/2006 |
| Wicomico Beach | XCC9680 | 4/5/2006 |
10/4/2006 |
| Blossom Point | XDB4544 | 4/5/2006 |
8/23/2006 |
| Fenwick | XFB0231 | 3/21/2006 |
10/4/2006 |
| Mattawoman Creek | XEA3687 | 3/21/2006 |
10/4/2006 |
| Piscataway | XFB2184 | 3/21/2006 |
10/4/2006 |
| SERC | XGE3275 | 1/1/2006 |
9/27/2006 |
| Betterton | XJH2362 | 3/30/2006 |
9/28/2006 |
| Georgetown Yacht Basin | XJI1871 | 3/30/2006 |
9/28/2006 |
| Beards's Creek | XGE7059 | 3/28/2006 |
9/27/2006 |
| Harness Creek Downstream | ZDM0001 | 6/7/2006 |
9/27/2006 |
| Harness Creek Upstream | ZDM0002 | 6/7/2006 |
9/27/2006 |
| Little Monie Creek | LMN0028 | 7/18/2006 |
9/12/2006 |
| Upper Ferry | WIW0144 | 5/9/2006 |
9/26/2006 |
| Whitehaven | XCJ6023 | 5/9/2006 |
9/26/2006 |
| Shady Side | XGE0284 | 3/28/2006 |
9/27/2006 |
Figure 2. Start and stop dates for the 44 stations used to generate the graphs in figure 1.
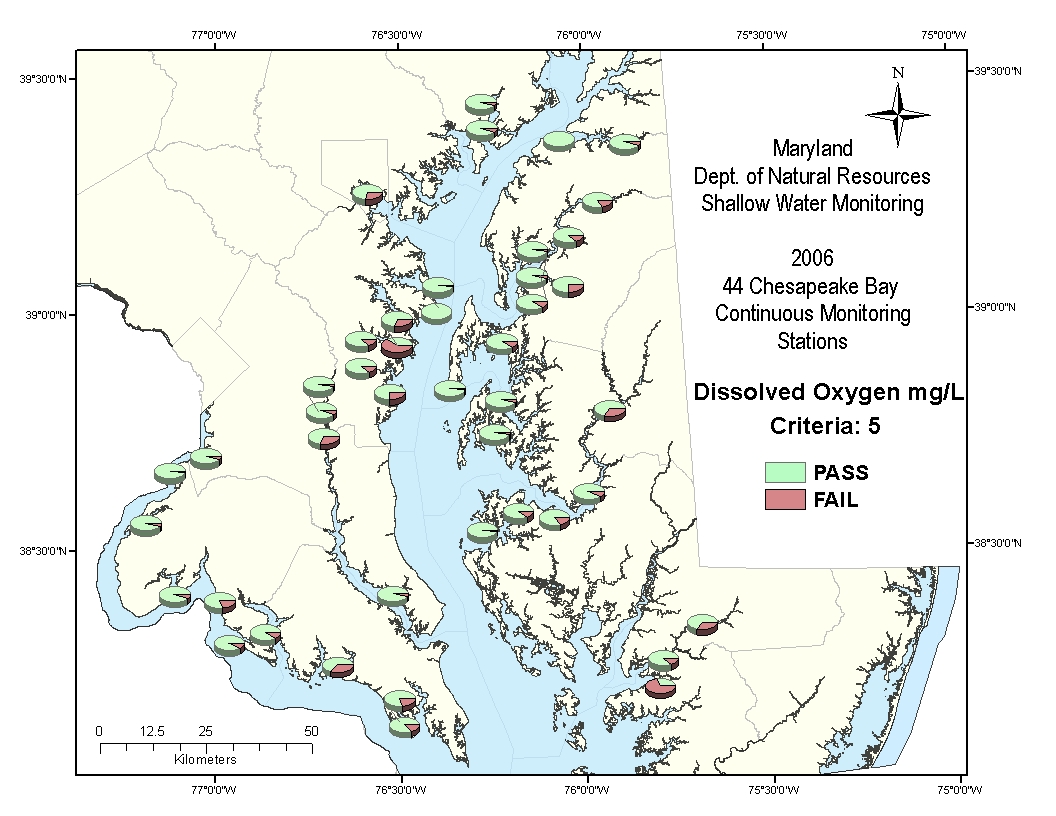
Figure 3. Pie charts showing the percentage of time which DO passed/ failed at 5 mg/l during 2006 for each of DNR's continuous monitoring stations.The criteria of 5 mg/l represents the minimum oxygen requirements for many aquatic living resources.
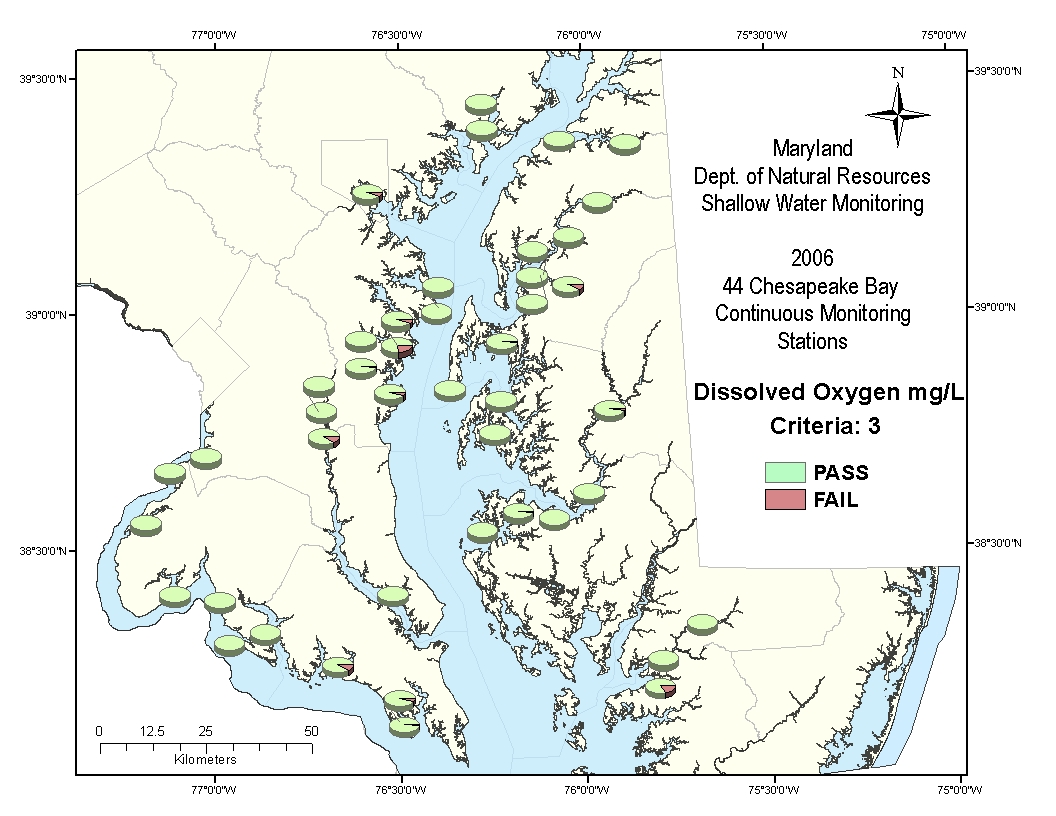
Figure 4. Pie charts showing the percentage of time which DO passed/ failed at 3 mg/l during 2006 for each of DNR's continuous monitoring stations.The criteria of 3 mg/l represents the point at which most living resources become adversely affected by the lack of dissolved oxygen.
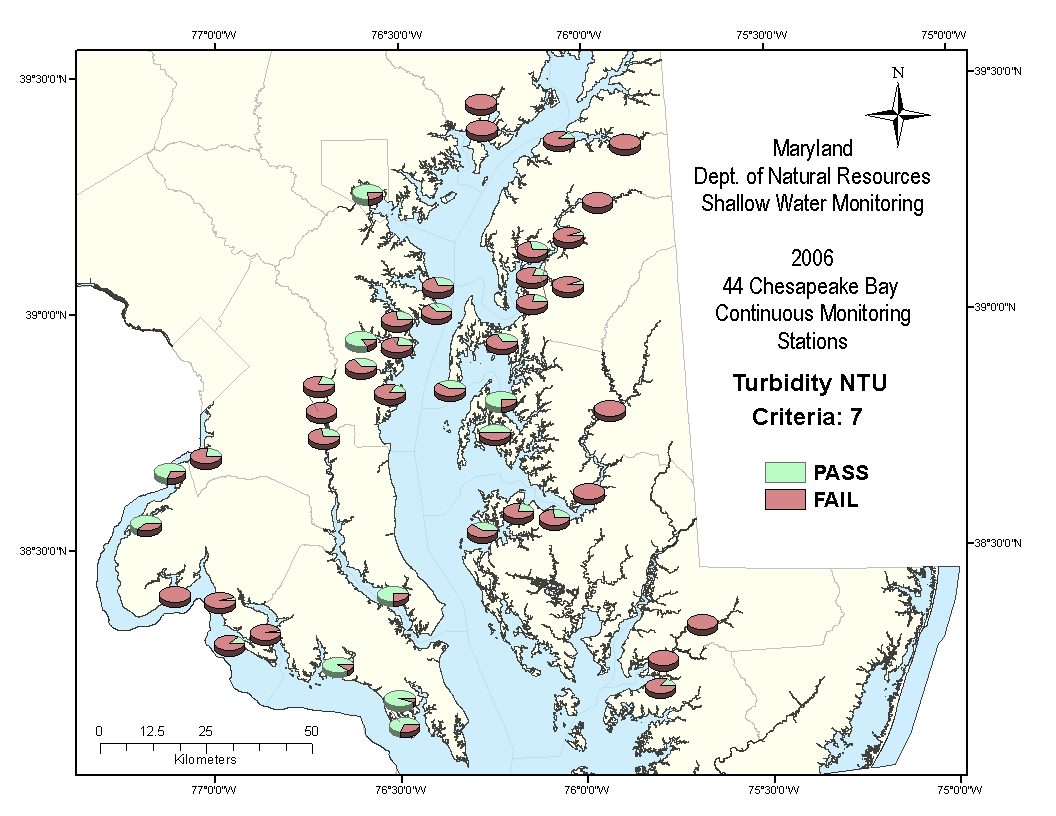
Figure 5. Pie charts showing the percentage of time that Turbidity passed/ failed at 7 NTUs during 2006 for each of DNR's continuous monitoring stations. The criteria of 7 NTUs is the point at which light can still penetrate1m into the water column.
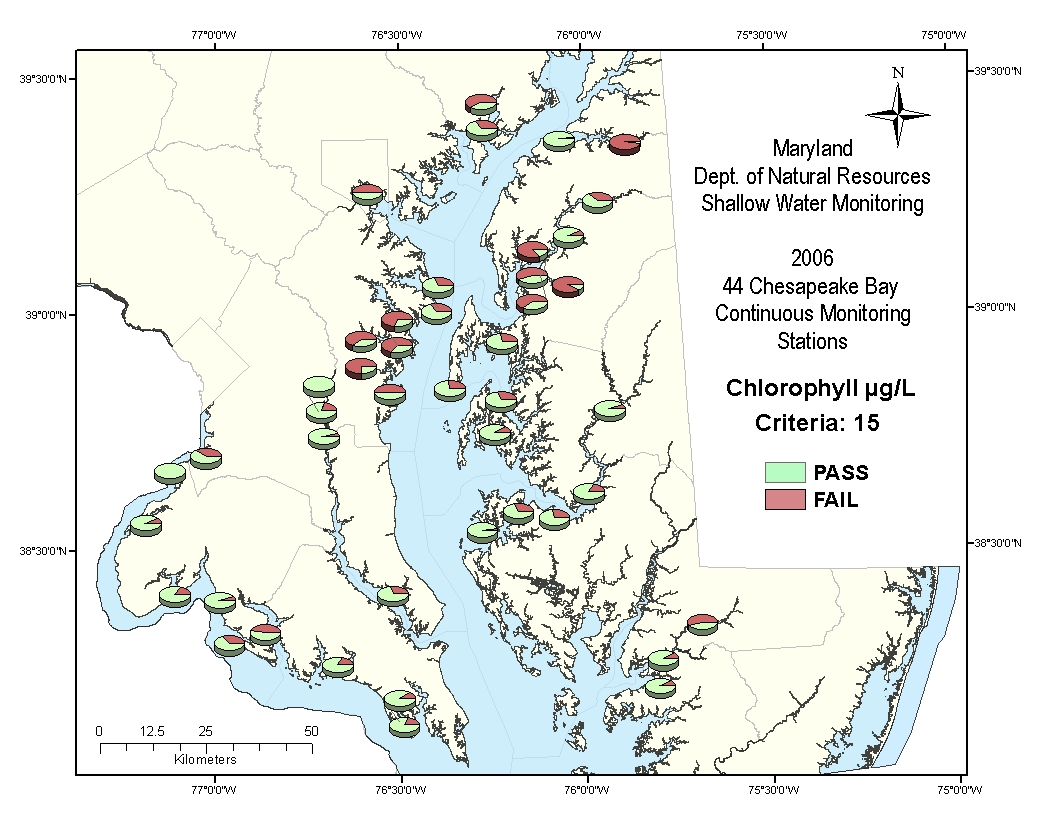
Figure 6. Pie charts showing the percentage of time Chlorophyll passed/ failed at 15 µg/l during 2006 for each of DNR's continuous monitoring stations. The criteria of 15 µg/l represents the point at which most living resources become adversely affected due to the increase in turbidity and toxins.
What can I do to lessen impacts on the Bay?
Storm events such as those seen this past spring and summer provide another reminder of the impact that impervious surfaces such as roads, rooftops and parking lots have on the natural landscape. Maryland's Tributary Strategies Program provides management opportunities to review and revise codes and ordinances to minimize the amount of hard surfaces added to the landscape through development. Homeowners should evaluate their properties and reduce the amount of runoff by adding rain barrels, installing rain gardens to capture runoff, plant trees, and disconnect downspouts to storm drains and roadways to release storm water runoff over lawns or unpaved areas instead. Alternative paving approaches for sidewalks and driveways reduce the amount of run-off and allow rainwater to soak into the ground.
Sources of information:
Water quality data, Maryland DNR website: www.eyesonthebay.net .