
Impacts of the June 2006 Extreme Rainfall
With the recent deluge of rain to the Chesapeake Bay watershed, many are wondering how this extreme meteorological event compares to the historical rains and flooding produced by Tropical Storm Agnes and how these rains will affect the Chesapeake Bay. Agnes was preceded by an unusually wet winter and spring, and was directly preceded by a cold front that produced an average of 1 to 3 inches, and up to 6 inches of rainfall. With an already saturated landscape, Agnes arrived and produced almost immediate flooding. Averages of 5 inches of rain or greater were observed watershed-wide, with one-third of the watershed recording 12 inches of rain, and isolated stations receiving 18 inches over the three day June 21-23 period.
The June 24 – June 28, 2006 rains were just as impressive as Agnes, but were instead preceded by quite dry periods with March 2006 being the driest March ever recorded. Watershed-wide radar estimates of rainfall can be observed in Figure 1. Isolated regions in the Bush, Potomac, Susquehanna and mid-Eastern Shore watersheds received an estimated 12-16 inches of rain. Much of the Chesapeake watershed received rains in excess of 8 inches.
Figure 1.

Source: www.intellicast.com
The peak average daily flows during Agnes were 1,130,000 cubic feet/second (cfs) for the Susquehanna at Conowingo Dam and 359,000 cfs for the Potomac at Washington, D.C.. The peak average daily flows of the June 2006 event for the Susquehanna were 403,000 cfs at Conowingo (Figure 2), and 76,700 at the Little Falls, Potomac Station (Figure 3). USGS, with funding from DNR, will continue to monitor and track the flows at the major tributaries. The Susquehanna flow at Conowingo peaked at 451,000 cfs at 8:30 pm on June 29, 2006 (Source: USGS)
Figure 2.
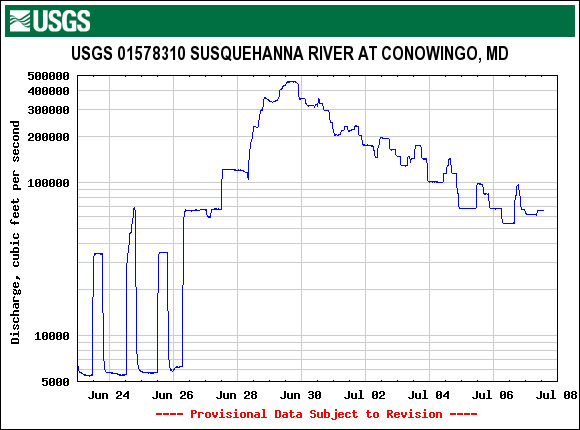
Source: USGS
Figure 3.
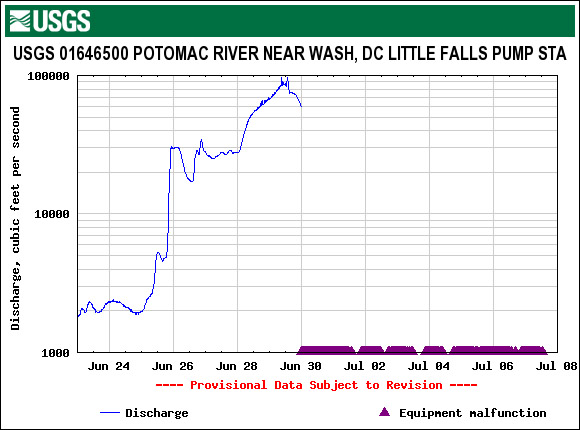
Source: USGS
Current Observations and Monitoring plans
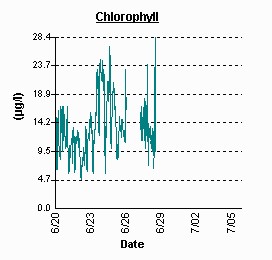
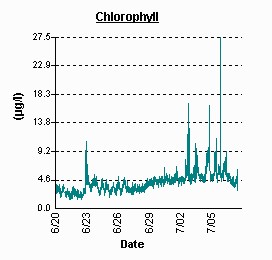
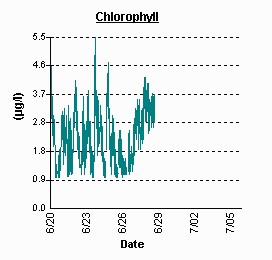
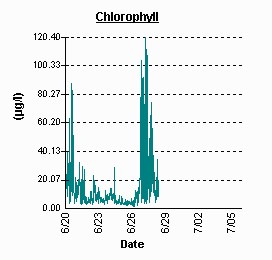
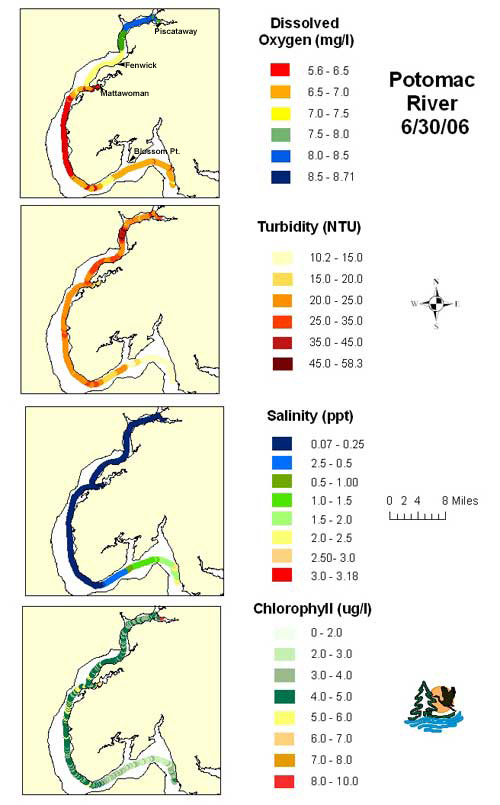
Continuous monitoring data, available on the Eyes on the Bay website, recorded many interesting water quality impacts throughout the Bay. Data from the four most upper-river continuous monitoring sites on the Potomac River show varying degrees and timing of sediment inputs as indicated by increasing turbidity (Figure 4). Each site showed declining dissolved oxygen levels below the 5 milligram/liter threshold which is deemed adequate to sustain healthy fish populations. The Blossom Point site appears to have experienced a large algal bloom several days after the delivery of nutrients from the storms. This chlorophyll signal could be indicative of other organic particles in the water that fluoresce, however. Results from a special water quality mapping cruise on the Potomac River show the highest turbidity occurring below Piscataway Creek, fair but adequate dissolved oxygen levels between Mattawoman and Blossom Point, and possible blooms off of and in Piscataway and Mattawoman Creeks (Figure 5).
Figure 4.
| Piscataway | 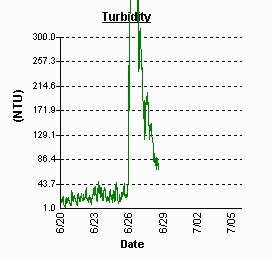 |
 |
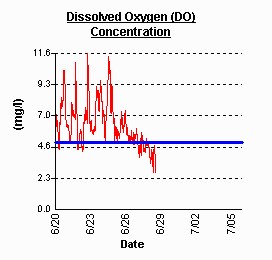 |
| Fenwick | 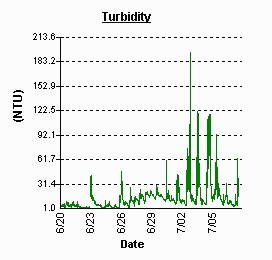 |
 |
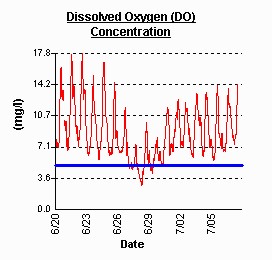 |
| Mattawoman | 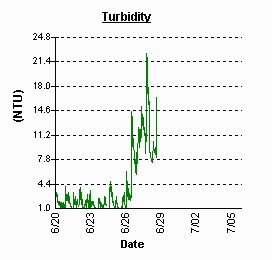 |
 |
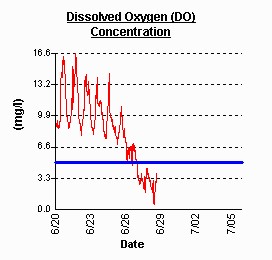 |
| Blossom Point | 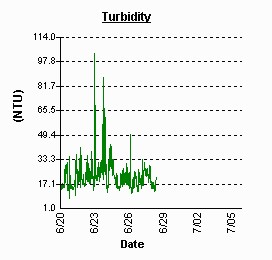 |
 |
 |
Figure 5. Results of Water Quality Mapping Cruise on June 30, 2006.
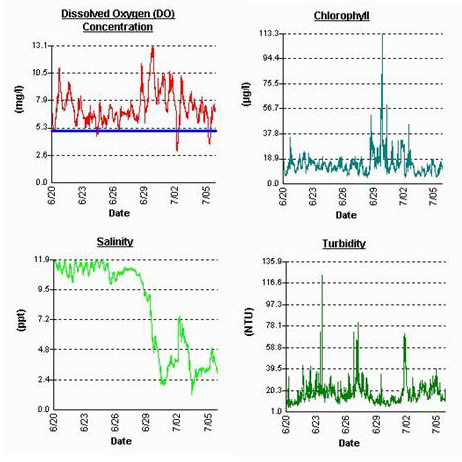
The Bush River watershed experienced some of the greatest rainfall totals statewide. Figure 6 shows that during the rainfall event, the upriver Otter Point Creek site was inundated with sediment laden runoff with turbidities greater than 300 NTU, and other parameters were mainly homogenous during the runoff event as freshwater rushed through the area.
Figure 6.
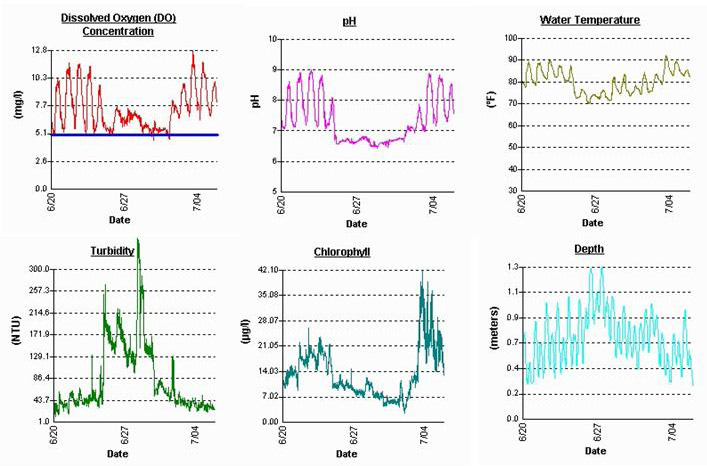
DNR's Sandy Point East site, near the Bay Bridge, is showing dynamic water quality conditions (Figure 7), but may not be catching the full variability and magnitude of conditions that are occurring in the main channel. Visual observations from the bridge, as well as from satellite imagery available from DNR, indicate that plumes of very turbid water from the Susquehanna and other upper Bay tributaries are advancing and retreating with the tides as well as laterally across the Bay. On July 7th, it appeared that the heaviest concentations of turbid water were centered along the main channel at the Bay Bridge with an obvious line of less turbid water to the East. The extent of the highly turbid plume appeared to reach far down Bay to perhaps the Choptank River. Its southern extent on July 3rd was only at the Bay Bridge.
Figure 7. Data from Sandy Point East
Source: http://www.eyesonthebay.net/
In response to the June 2006 rain events, DNR and its Chesapeake Bay Program partners will conduct supplemental monitoring cruises over the next several weeks in order to accurately document the impacts of the record setting rain events to water quality, habitat and living resources, especially SAV, and compare and contrast this event to hurricanes Agnes and Isabel. In addition to these supplemental cruises, DNR expanded its Chesapeake Bay Monitoring efforts in 2003 to include spatially and temporally intensive monitoring that will allow us to better assess individual tributaries. Forty-seven continuous monitors are placed in various tributaries, providing water quality measurements every 15 minutes April through October, providing pre-, during and post- storm event water quality monitoring results at a scale never before seen. Data may be viewed at the DNR website, Eyes on the Bay (http://www.eyesonthebay.net/).
DNR will also be conducting regular monthly water quality mapping cruises on the Potomac as part of the comprehensive Potomac Shallow Water Monitoring project initiated in April 2006. These cruises are conducted over 4 consecutive days each month in cooperation with the University of Maryland and Saint Mary’s College. The next spatially intensive Potomac Shallow Water cruise is scheduled for the week of July 17 th and will provide geographically specific impacts throughout the Potomac estuary.
The University of Maryland will also be conducting supplemental water quality mapping cruises for the Patuxent estuary on June 29 th and July 5 th that will be compared to monthly water quality mapping cruises funded by DNR. Over the next several weeks, DNR, along with its partners, will be assessing all these data to determine the short and long-term impacts of June 2006 high flows to tributary specific water quality.
DNR will be in the northern Chesapeake Bay in the coming weeks eradicating the invasive water chestnut plant and will evaluate the impacts that this rainfall and runoff has on submerged aquatic vegetation habitats.
What can I do to lessen impacts on the Bay?
Storm events of this magnitude provide another reminder of the impact that impervious surfaces such as roads, rooftops and parking lots have on the natural landscape. Maryland's Tributary Strategies Program provides management opportunities to review and revise codes and ordinances to minimize the amount of hard surfaces added to the landscape through development. Homeowners should evaluate their properties and reduce the amount of runoff by adding rain barrels, installing rain gardens to capture runoff, plant trees, and disconnect downspouts to storm drains and roadways to release storm water runoff over lawns or unpaved areas instead. Alternative paving approaches for sidewalks and driveways reduce the amount of runoff and allow rainwater to soak into the ground.
Sources of information:
- Driest March: NOAA, www.noaanews.noaa.gov/stories2006/s2612.htm
- Radar data: www.intellicast.com
- Flow data from USGS website: http://waterdata.usgs.gov
- Agnes data source: Chesapeake Research Consortium. 1972. “The Effects of Tropical Storm Agnes on the Chesapeake Bay Estuarine System.”