
Tred Avon NOAA Vertical Profiler
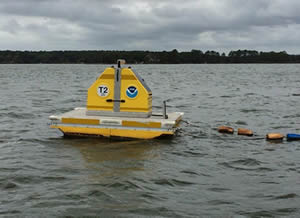 Beginning in 2014, the National Oceanic and Atmospheric Administration (NOAA) deployed a vertical profiler to monitor water quality conditions in the Tred Avon River, an important oyster restoration area in the Chesapeake Bay. Once an hour, the vertical profiler measures salinity, water temperature, pH, dissolved oxygen, chlorophyll, and turbidity at one meter intervals throughout the water column. The Maryland Department of Natural Resources (DNR) has teamed with NOAA to provide field support for the profiler, monitor operation, download data files, and review the data for quality assurance.
Reports:
- 2018: Vertical Profiler Water Quality Monitoring in the Tred Avon River - April to November 2018
- 2017: Vertical Profiler Water Quality Monitoring in the Tred Avon River - June to December 2017
- 2016: Vertical Profiler Water Quality Monitoring in the Tred Avon River - June to December 2016
- 2015: Vertical Profiler Water Quality Monitoring in the Tred Avon River - June to September 2015
- 2014: Vertical Profiler Water Quality Monitoring in the Tred Avon River - June to October 2014
Profile Charts:
The charts below display the most recently recorded water quality profile available in the Eyes on the Bay database. Right-click in the chart area to display menu options, and mouseover datapoints to see data details.
Click each parameter to view chart: (Please be patient while chart is generated)
Most Recent Data Record: EST
For dissolved oxygen, a black contour line follows the hypoxic threshold value of 2 mg/L
Data Download:
Use the following query tool to download desired raw data for the Tred Avon NOAA Vertical Profiler. Data will automatically download with columns for any available data-flag codes for each parameter, as well as a 'comments' column, and the sonde identification name used for each deployment period.