
A Brief Explanation of the Data Available for Viewing
The data being displayed represent many of the key measures of water and habitat quality for living resources such as fish, crabs and oysters. This information is being collected to guide the restoration of the Chesapeake Bay, its tributaries, Coastal Bays, and Maryland lakes by identifying specific problems and evaluating the success of management initiatives. Like the atmosphere we are more familiar with, water is a dynamic environment. Just as our weather - temperature, humidity and precipitation - varies from hour to hour and from season to season, aquatic habitats – using measures such as dissolved oxygen, chlorophyll (algae) and water clarity - are constantly changing as well. In order to understand our impacts on the Chesapeake Bay, tributaries, and lakes, and long-term trends in water and habitat quality, we must be able to measure and account for these short-term and seasonal dynamics.
Dissolved Oxygen
The amount of oxygen dissolved in Chesapeake Bay, tributary, or lake waters is probably the single most important measure of habitat quality; without oxygen, all of the living resources familiar to us perish. Dissolved oxygen (DO) is measured as a concentration (mg/l – milligrams per liter). When DO concentrations drop below 5 mg/l, more sensitive organisms, such as fish, become stressed, especially if exposed to these conditions for prolonged periods. Bottom-dwelling organisms such as worms are usually more tolerant, and some species can survive at levels down to 1 mg/l in some cases. However, most aquatic organisms will not survive exposure to water with less than 1 mg/l of dissolved oxygen for more than a few hours.
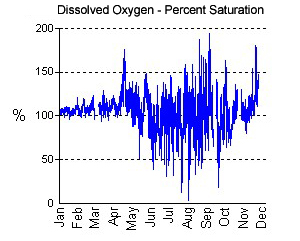
An example from the Magothy River continuous monitoring station at Stonington showing little variation in winter and early spring dissolved oxygen (DO) levels, supersaturation of DO in the late spring, and highly variable summer DO levels.
The concentrations of DO are affected by several factors. Temperature affects the concentration since warmer water cannot dissolve as much oxygen as colder water. The percent saturation graphs for oxygen from the continuous monitoring stations show the amount of oxygen in the water relative to a theoretical maximum, which is approximately 8 mg/l during summer and about 14 mg/l in the coldest months. Supersaturation (over 100% DO saturation) can occur when there is a large algal bloom. During the daylight, when the algae are photosynthesizing, they can produce oxygen so rapidly that it is not able to escape into the atmosphere, thus leading to short-term saturation levels of greater than 100%.
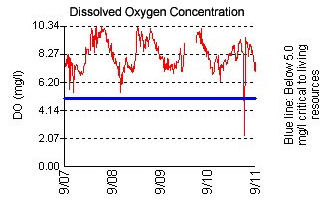
An example from the Pocomoke River continuous monitoring station at Cedar Hall Wharf showing dissolved oxygen (DO) daily variations, with peaks in late afternoon and minimums at dawn. This is due to the production of oxygen by algae (measured by chlorophyll) during the daytime and the consumption of oxygen at night by the algae and other organisms in the water and bottom sediments.
In most cases, the DO graphs from the continuous monitoring stations show daily variations, with peaks in late afternoon and minimums at dawn. These peaks are due to the production of oxygen by algae (measured by chlorophyll) during the daytime and the consumption of oxygen at night by algae and other organisms in the water and bottom sediments. These daily swings can be quite large when there are algae blooms fueled by nutrient pollution, and they often result in fish kills when oxygen levels drop to around 1 mg/l or less.
The deeper areas of the Chesapeake Bay, tributaries, and lakes tend to show very low oxygen conditions during the summer as can be seen in the monthly data for the mainstem and the lower sections of the larger tributaries. A depression in DO concentrations is natural in these deep waters due to restricted mixing, but the problem has been made worse by nutrient-fueled algae blooms that sink and decompose in these areas.
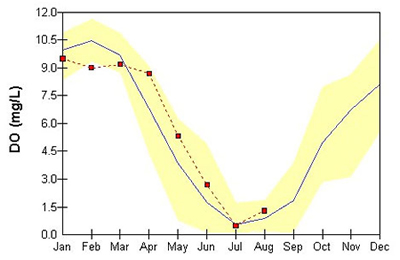
An example from the deep-water, mainstem Chesapeake Bay station - Point No Point (Mid-Channel Chesapeake Bay, Station Name = CB5.2) showing low dissolved oxygen (DO) in the summer.
Algal Blooms
Algal blooms, can be very damaging to aquatic habitats since they can drive DO concentrations to very low levels. Excess algae, usually caused by an excess of nutrients which stimulate their growth, can also make the water cloudy, or turbid, blocking the light needed by bay grasses, or submerged aquatic vegetation (SAV).
These damaging algae blooms, which can also produce toxins in some cases, are collectively known as harmful algal blooms. The amount of algae in the water is measured as chlorophyll concentration (ug/l – micrograms per liter). Chlorophyll is the main chemical responsible for photosynthesis in plants, the process by which sunlight is converted into food energy.
There are no hard and fast rules as to what constitutes a harmful concentration of chlorophyll but as a general guide, above 50 ug/l represents a significant bloom and above 100 ug/l represents a severe bloom. Some research suggests that harmful effects can occur at chlorophyll concentrations as low as 15 ug/l.
Turbidity
Secchi depth is a measure of the clarity, or turbidity of the water. Secchi depth is measured using a circular plate, called a Secchi disk, which is divided into quarters painted alternately black and white.
The Secchi disk is lowered into the water until it is no longer visible, and that depth is measured. Secchi depth values that are high indicate clearer water, and low Secchi depths indicate high turbidity. Turbid waters typically appear cloudy and have high concentrations of total suspended solids (TSS), thereby allowing less light to penetrate through the water. As described above, increased turbidity is often due to excessive algal growth. However, turbidity can also increase due to land run-off and shore-line erosion, pollution, resuspension of bottom sediments, dredging operations, or during high periods of fresh-water input from rivers and streams.
Turbidity is typically high in areas known as turbidity maximum zones, which occur at the edge of salt wedges where freshwater and saltwater mixing occurs. Highly turbid waters, or waters with low secchi depth, tend to prevent the growth of bay grasses, which provide DO to the water column and critical habitat for many fish and invertebrate species.
Water clarity can also be measured more accurately using a transmissometer, which records turbidity values in Nephelometric Turbidity Units (NTUs). Turbidity values over a threshold of 15 NTUs are normally considered to be detrimental to bay grass growth. Increased turbidity can also lead to decreased fish health by increasing susceptibility to infectious diseases through increased stress, and reducing the ability of fish's gills to extract DO from the water. High areas of turbidity can also cause the silting over of benthic organisms, the equivalent to being buried alive. However, this silting is more common in areas of dredging where large quantities of sediment are disturbed over short periods of time.
Salinity
The concentration of salt, or salinity, is a function of the mixing of freshwater from Chesapeake Bay tributaries with ocean waters, which contain approximately 32 ppt (parts per thousand) salinity. In any given location, salinity can vary greatly depending upon river flow, being low during high flows and high during droughts.
Most of the Bay's living resources are adapted to these large swings in salinity, but extreme floods or droughts can lead to stressful conditions. For example, prolonged extreme low salinity can lead to mortality of clams and other benthic organisms. Conversely, extended periods of high salinity brought on during periods of drought can lead to mass oyster mortality, by increasing the distribution and virulence of oyster parasites.
Extended periods of high salinity can also force fish that prefer lower salinities, such as yellow perch, out of river mainstems and up into headwater creeks. These areas often have large algae blooms and low DO conditions, which can be stressful or even lethal to fish. Freshwater species of bay grasses, such as wild celery, cannot move and may be stressed or killed by the rising salinities brought on by a drought.
Temperature
Temperature, like salinity, undergoes wide variations seasonally, although it is much less variable and much more predictable than any other habitat measurement displayed here.
This can be seen by looking at the historical range for the long-term stations for any given month. This relative stability is due to the heat retaining properties of water, which make it much more resistant to temperature changes than our atmosphere.
pH
pH, in simple terms, is a chemical measure of whether or not something is an acid or a base. It is measured on a log scale of 0 to 14, with each unit representing a ten-fold change. A pH of 7 is considered neutral and a range of 5.5 to 8.5 is usually tolerated by most aquatic organisms.
pH Scale: A measure of acidity and alkalinity on a scale of 0 to 14.
Lower pHs are sometimes seen in fresher waters due to acid precipitation or even naturally-occurring organic acids, which can be found in areas with extensive marshes. High pHs can occur during algae blooms due to chemical processes associated with photosynthesis. Moderate to higher salinities usually “buffer” pH in the 7 to 8 range, so most of the more extreme values will be found in low salinity situations.
There are many interactions among the various water and habitat quality measurements described above, some of which have already been mentioned. The displays of time series for the various stations provide an excellent opportunity to explore some of these relationships.