
Long-term Fixed Station
Monthly Monitoring Program
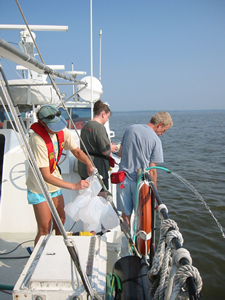 The fixed station monthly monitoring program consists of sites that have been sampled monthly or twice monthly since 1984. Sites are visited by our Research Vessel Kerhin and smaller boats, or accessed via road/ferry crossings. Water quality profiles are taken, as well as nutrient, sediment, and chlorophyll samples.
These data are the backbone of the Chesapeake and Coastal Bays management and restoration efforts. They are instrumental in determining the long-term trends and current status of water quality in the region. The data underlie products such as water quality report cards and barometers, as well as models that help to refine watershed management efforts.
Fixed station, monthly monitoring data and charts are currently available for 101 stations. Virginia follows identical sampling protocols and while our Maryland Long Term data downloads and charts can be found by following the links below, full data results are also available via the EPA Chesapeake Bay Program Data Hub.
Fixed Station Monitoring Data Resources:
Click the titles or images below to navigate to each data resource.
1. Fixed Station Monthly Monitoring - Station Information Table
|
|
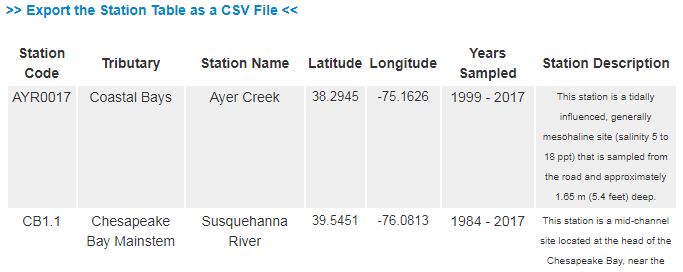
| You can view and download Long Term Fixed Station Monthly Monitoring basic station information in table form, including station coordinates and information on depth locations of water quality meters at each station. Where available, there are direct data download links to Eyes on the Bay Long Term Monthly Monitoring Data stored on the Chesapeake Bay Program's DataHub, available for one station at a time. |
|
| Note: Option 4 on this page offers a link to a fully customizable data download page. | |
2. Fixed Station Monthly Monitoring Current vs Historical Charts: |
|
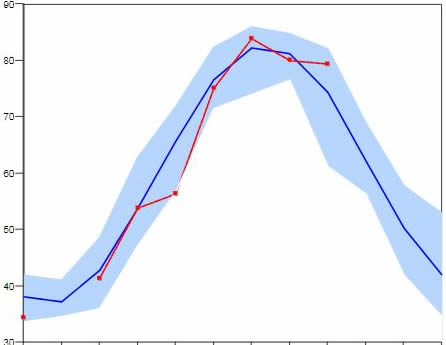
| Long Term Fixed Station sampling has been conducted once or twice monthly since 1984. Water quality profiles are taken, as well as nutrient, sediment and chlorophyll samples. The Fixed Station Current vs Historical Data Charts plot water quality values from the current month with the historical range (minimum to maximum recorded values) and the historical average. Surface water values are plotted for all parameters except dissolved oxygen, where bottom water values are instead used. |
|
3. Fixed Station Monthly Monitoring Profile Charts: |
|
|
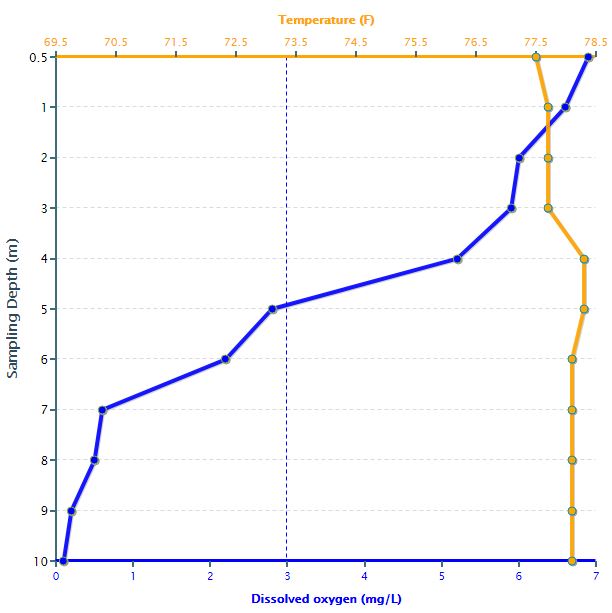
Water quality data from our Long Term Fixed Station Monthly Monitoring Program is collected at ~1m depth intervals and is known as a 'water quality profile'. In this chart query you can choose to view a profile chart comparing two water quality parameters to see how values change with depth, for your chosen station and sampling date. You can also see these charts applied in our interactive 'Do Not Fish Below This Depth' and our 'Water Temperature By Depth' fishing maps. |
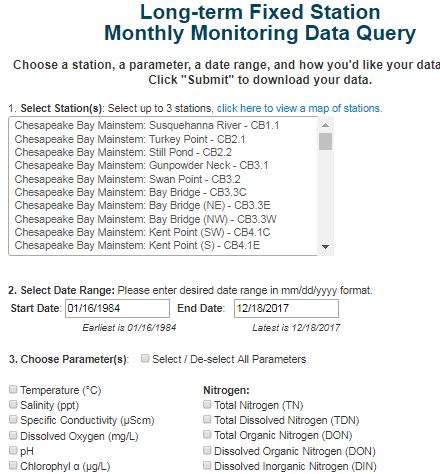
4. Fixed Station Monthly Monitoring Data Query & Download: |
|
|
The raw data collected by our Fixed Station Monthly Monitoring program are stored at the Chesapeake Bay Program's DataHub, but can now also be easily downloaded by using our Long-Term Fixed Station Monthly Monitoring data query page. These data are the backbone of the Chesapeake and Coastal Bays management and restoration efforts. They are instrumental in determining the long-term trends and current status of water quality in the region. On our data query page you can choose your desired stations, date range, and choose from among 36 water quality parameters and download a .csv file of data. |
|