The real-time/near-time Continuous Monitoring Program, which is funded in part by a grant from NOAA, is designed to collect water quality data throughout the Chesapeake and Coastal Bays in an effort to discern the links between water quality, harmful algal blooms, and fish kills.
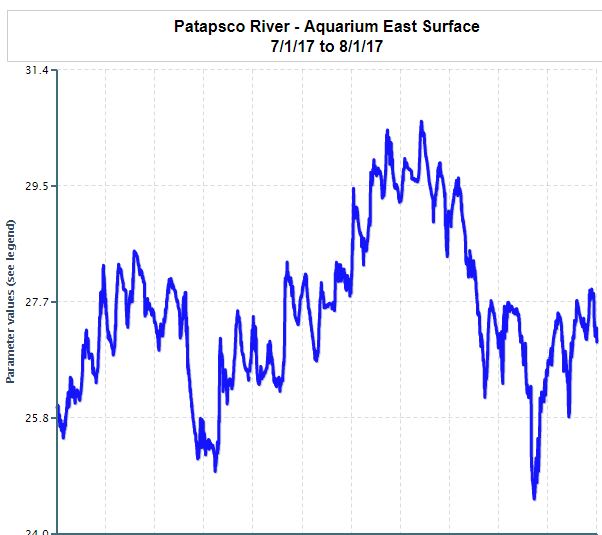
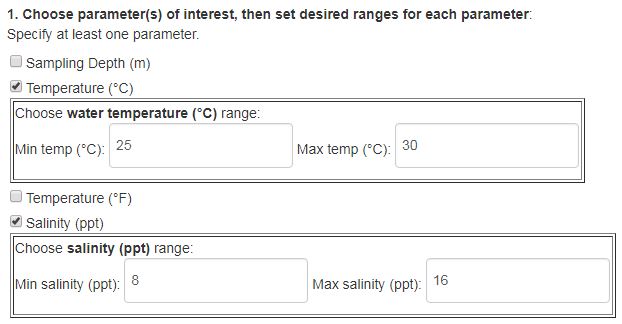
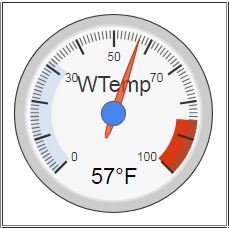
The instruments generally used by the Continuous Monitoring Program are YSI 6600 and YSI EXO sondes. While some meters are anchored to the river bed (0.3m above bottom), most are located at a constant depth of 1m below the surface of the water. Each instrument is programmed to record seven parameters every 15 min: water temperature, salinity, dissolved oxygen (DO) saturation, DO concentration, pH, turbidity, and fluorescence (a measure of chlorophyll-α present in the water column). Some stations are also equipped with telemetry systems which provide real-time data. These 15min-increment measurements are referred to as 'continuous measurements (opens in popup)' and can be accessed via Option 3 below.
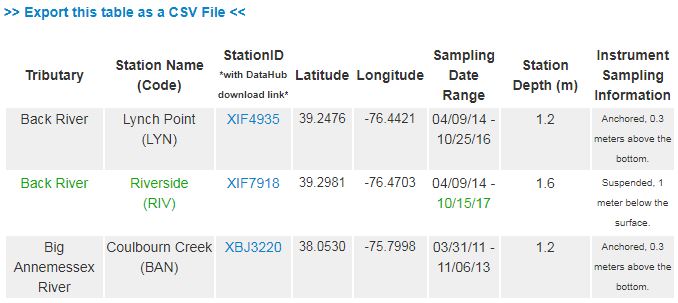
Every two weeks, the water quality meters need to be exchanged for cleaning and calibration. During this time additional measurements are recorded by the scientists switching out the meters. In addition to recording water quality data (water temperature, specific conductance, salinity, dissolved oxygen, pH, etc) which are used for calibration comparisons and data quality assurance between the meters, they also measure secchi depth, photosynthetic active radiation (PAR)/light attenuation, and take samples for measurement of Total Suspended Solids (TSS), chlorophyll a and pheophytin a. Additionally, at some stations, samples are also taken for the measurement of VSS, PC, PIP, TDN, TDP, NH4,TN, TP, PO4, NO2, NO2 3. These data are referred to as the 'calibration data (opens in popup)' and are available to download using either Option 2 or 3 below.
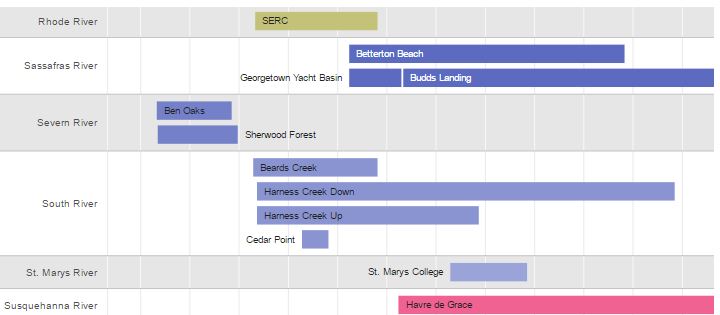
For a link to a map of calibration stations for all shallow water monitoring programs, visit the Calibration Station Map (opens in new window).