
Water Quality Mapping Instrumentation
The Water Quality Mapping program uses a technology known as DATAFLOW to rapidly collect spatially intensive water quality data in the Chesapeake Bay and Coastal Bays. Maryland DNR contracts The University of Maryland Center for Environmental Science, Chesapeake Biological Laboratory (CBL) (opens in new tab) to design, construct, and innovate its DATAFLOW units.
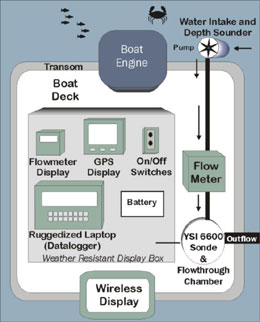
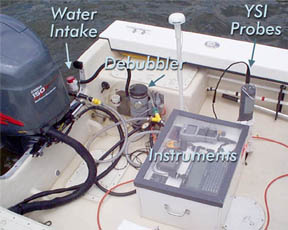
CBL has refined the original Dataflow, first developed by Madden and Day (1992), evolving the system into the current implementation, Dataflow 5.5. Dataflow surveys are conducted from a small CBL fleet vessel and a typical cruise involves a complement of two field technicians to perform sampling operations. The Dataflow 5.5 package consists of a surface water intake and circulation system that is sampled at a prescribed rate by a Yellow Springs, Inc. 6600 DataSonde. This sensor provides data on dissolved oxygen, temperature, conductivity, pH and salinity, as well as turbidity and fluorescence (from which we derive chlorophyll-a concentration). These values, along with depth-under-keel and global position are logged with a ruggedized microcomputer using software developed by staff at the Virginia Institute of Marine Science (opens in new tab). The vessel travels at speeds of up to 20 knots while collecting data. At this rate a field crew may quickly characterize the spatial patterns of water quality within a river system.
The latest generation Dataflow 5.5 unit that CBL has developed for the Maryland Department of Natural Resources sports further refinements in spatial resolution and ease of operation. A single, high flow pump is used to facilitate faster water sample exchange within the system, reducing sample residence time, thereby improving mapping resolution. This resolution is further enhanced by a Wide Area Augmentation System (WAAS) enabled GPS unit which provides for a best-case positional accuracy to within three meters. A novel feature is the addition of a wireless display unit with which field technicians may monitor water quality data from anywhere on deck. This use of a microcomputer and wireless display opens the door to further real-time mapping and analysis applications.
To download DATAFLOW data or view spatially interpolated maps of surface water quality data, visit our DATAFLOW Surface Maps and Data page.