
Bay Grasses (Submerged Aquatic Vegetation)
Bay Grass Coverage and Habitat Status
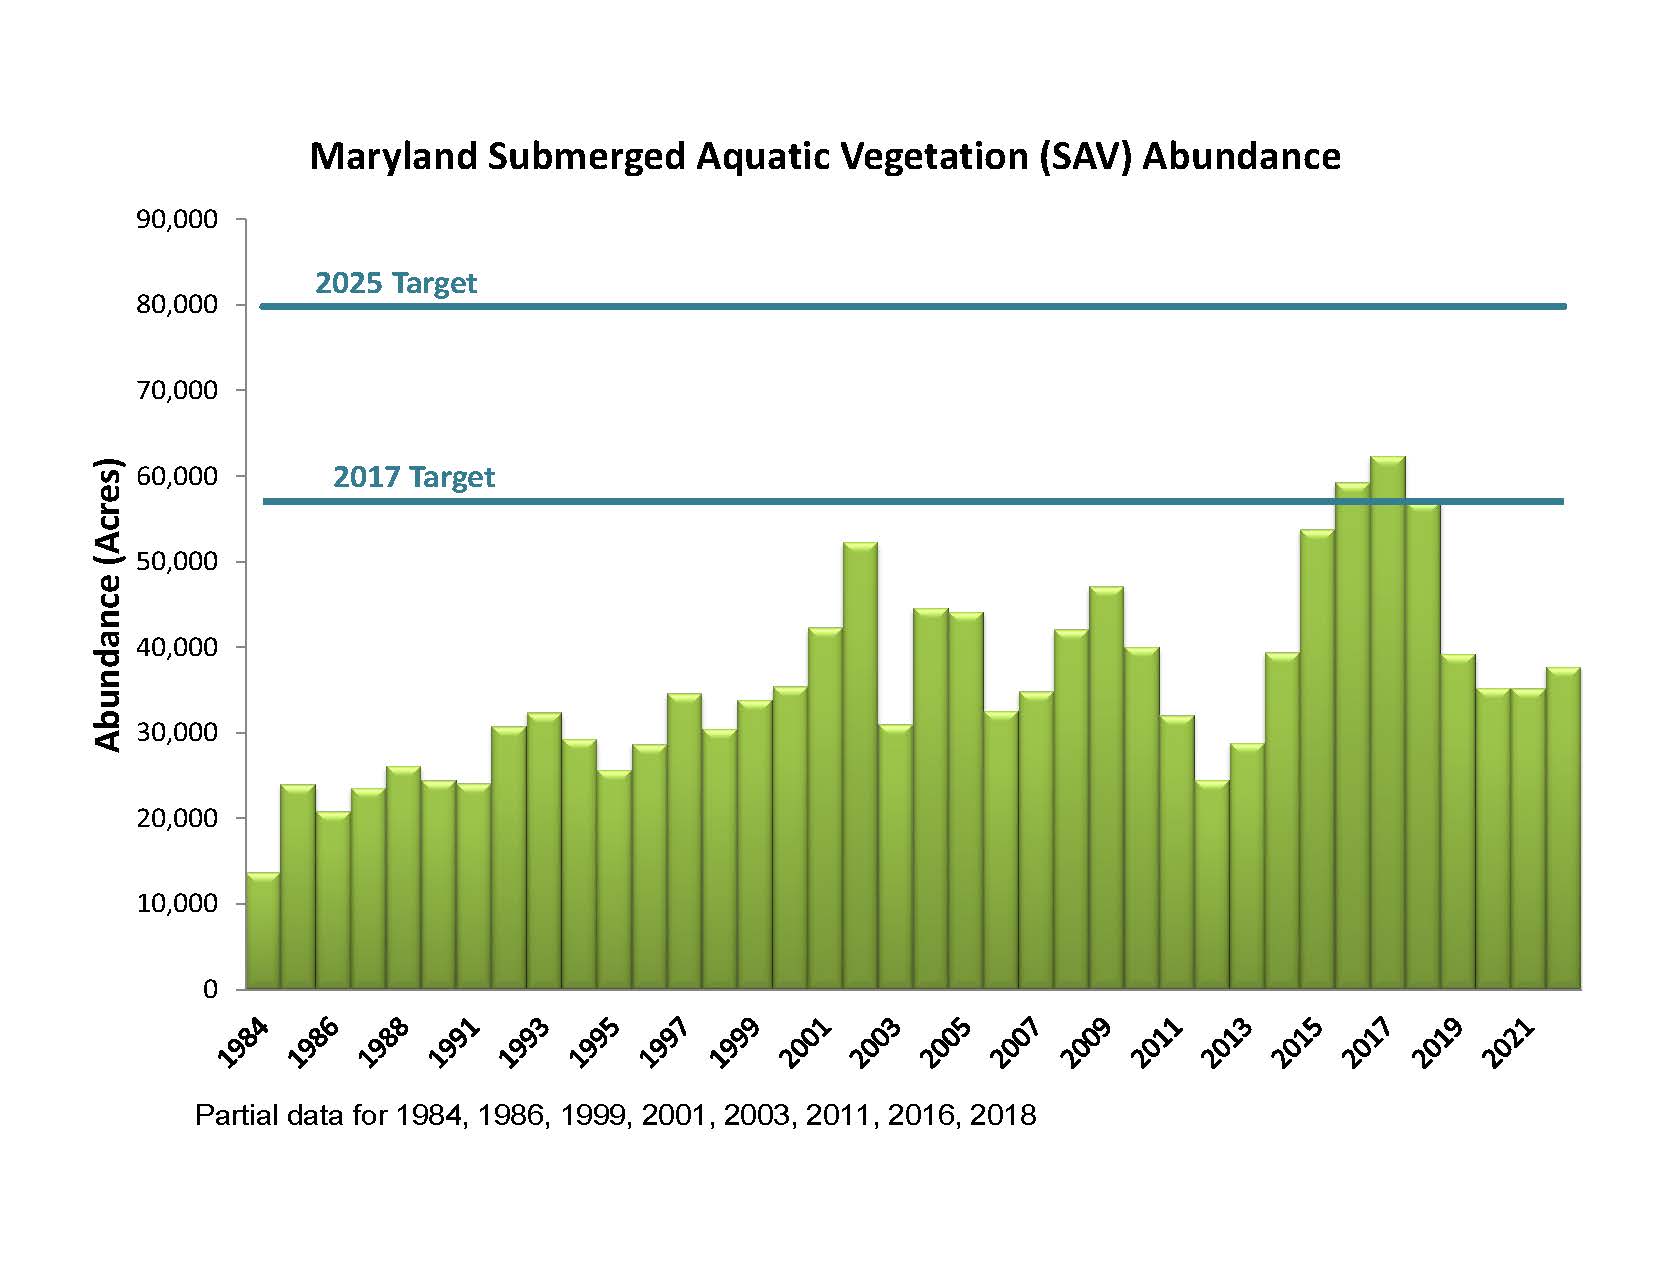
The abundance of bay grass in Chesapeake Bay has fluctuated greatly since the Virginia Institute of Marine Science (VIMS) started mapping the resource in 1984. The following is a timeline of events that have affected the growth of bay grasses over the last century:
| 1930s | Eelgrass, the most widely distributed species in the bay, was nearly decimated by “wasting disease” in the early 1930s. |
|---|---|
| 1940s | Despite significant increases in bay grass numbers by the 1940s, introduction of exotic species such as water chestnut and Eurasian watermilfoil displaced many native bay grasses. |
| 1962 | Mute swans reproduced rapidly and began feeding on bay grasses after their introduction in 1962. |
| late 60s-early 70s | Large scale declines in submerged aquatic vegetation in the late 60s and early 70s due to increases in nutrients and sediments to the bay. |
| 1972 | Tropical Storm Agnes (1972) caused widespread damage to bay grass beds. |
| 1978 | Tracking of bay grass populations by scientists began in 1978. |
| 1984 | VIMS started mapping bay grasses with aerial photography in 1984. |
| 2002 | In 2002, bay grasses reached record high numbers with an estimated 85,252 acres of SAV mapped Chesapeake Bay-wide. |
| 2011 | Hurricane Irene and Tropical Storm Lee (2011) significantly reduced underwater grasses in the upper part of the bay. |
| 2015 | Underwater grasses reached 53,277 acres in Maryland's portion of the Chesapeake Bay in 2015, the highest abundance ever recorded by the aerial survey. |
| 2016 | In 2016, underwater grasses increased for the fourth straight year in the state's portion of the Chesapeake Bay, reaching a record of 59,277 acres. |
| 2017 | Underwater grasses reached 62,357 acres in Maryland's portion of the Chesapeake Bay in 2017, surpassing the 57,000 acre target and achieving a new record for the third consecutive year. |
| 2018 | Maryland experienced record high rainfall and stream flows into the Chesapeake Bay in 2018 and 2019. This led to higher levels of nutrient and sediment pollution, poorer water clarity and record low salinities in many of Maryland’s waterways. Because of these reduced habitat conditions, underwater grass abundance declined in 2018 and again in 2019 to 39,151 acres. |
| 2019 | |
| 2021 | Maryland’s waterways experienced a slight (6%) increase of SAV between 2021 and 2022. 37,297 acres of SAV were mapped in Maryland’s waterways in 2022. |
| 2022 |
Accessibility Notice: We are currently working to ensure all SAV PDFs are fully accessible. If you have an immediate need for an accessible version of a document, please contact us at brooke.landry@maryland.gov.
View Maryland's Tributary-Specific Bay Grass Coverage and Habitat Status
(1984-2022)
View Baywide Yearly SAV Monitoring Project Reports at Virginia Institute of Marine Science:
View the most recent Baywide SAV Monitoring Report here.