
Choptank River Vertical Profiler
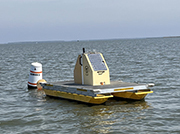
The vertical profiling system consists of a controller, winch, and data logging and telemetry system mounted on a floating platform. The winch is used to lower the datasonde down into the water column. The Choptank River vertical profiler is currently setup to sample at 0.5, 1, 2, 3, 4 and 5 meters every hour. Data from the individual profiles are interpolated to generate a graphic which depicts water quality conditions over time.
Click each parameter to view chart:
Please be patient while chart is generated
Note: Each color increment in the legend represents a 5°C change in water temperature.
Please be patient while chart is generated
Note: Each color increment in the legend represents a 20 µg/L change in chlorophyll.
Please be patient while chart is generated
Please be patient while chart is generated
Note: Each color increment in the legend represents a 0.05 change in pH units.
Please be patient while chart is generated
Note: Each color increment in the legend represents a 20 ntu change in turbidity.
*Data are provisional and have not yet been through our rigorous Quality Assurance procedures.
Chart Tips:
- To access chart tools:
- Mouseover the chart to reveal the navigation tools in the top right
- To pan to earlier dates:
- Choose the Pan icon
 and drag the chart to the desired dates
 - To select a specific date or date series:
- Choose the zoom icon
 and select and highlight the desired range.
 - Double-click to zoom out.
- To reset axes:
- Choose the home icon

- Double-click the chart to reset
- To save chart as image:
- Choose the camera icon
