Eyes on the Bay Data Information Harbor:
The information and tools on the following pages explain our data program, and should help you navigate to the data type best suited for your data needs:
Data Types Overview (opens in a new tab):
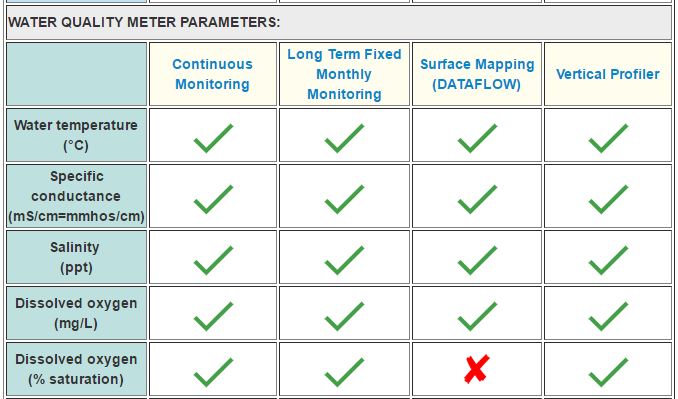
The table on our Data Types Overview page provides comparative information to help you determine what type of Eyes on the Bay data best suits your needs, what parameters are collected for each data type, and explains what data are available for download.
Parameters Overview (opens in a new tab):
Our Monitoring Explained page provides information about the water quality parameters that we measure, and explanations of why monitoring each parameter is important to determining Chesapeake Bay health.
Data Use Policy & Citation Methods (opens in a new tab):
Please refer to our Data Use & Citation Methods document for guidelines on data use, and methods for correct attribution when using Maryland DNR Eyes on the Bay data in poster or oral presentations, manuscripts, and other publications.
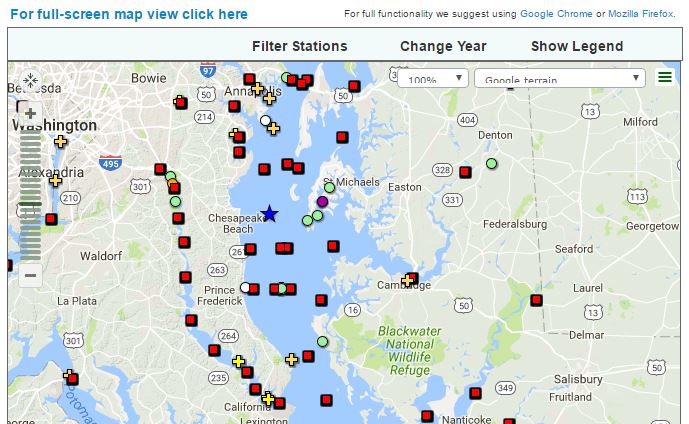
Main Station Map:
Our interactive Main Station Map displays all the stations where we collect water quality data, as well as partner stations. Use this map to explore the stations we are currently sampling, as well as to view stations from previous years. You can also toggle different data types on or off. Clicking on stations also shows snapshots of data, and links you to data downloads and charts.
Data Programs:
Click each sampling program to expand information and find links to download or view data.
Continuous Monitoring Program:
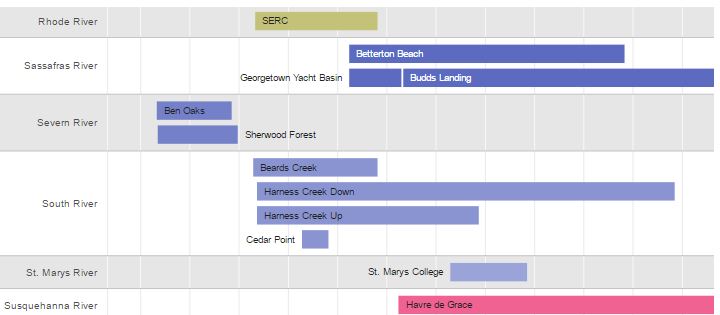
1. Continuous Monitoring Station Timeline (opens in a new tab):
This interactive timeline graphic shows years of data available for all Continuous Monitoring stations. This tool can help when choosing sites of interest, and for comparing years of sampling between or among stations.
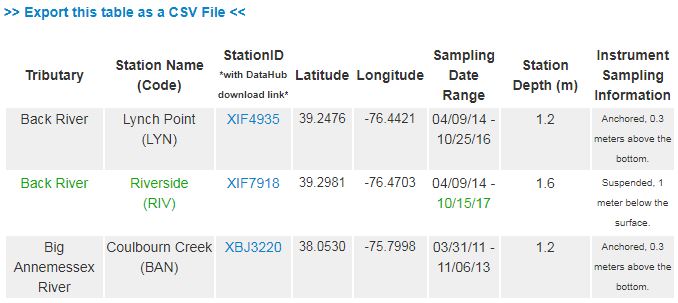
2. Continuous Monitoring Station Information Table (opens in a new tab):
You can view and download Continuous Monitoring Station Information in table form, including station coordinates and information on depth locations of water quality meter at each station. This table also includes direct links to data downloads of 'Calibration Data' from the Chesapeake Bay Program's DataHub.
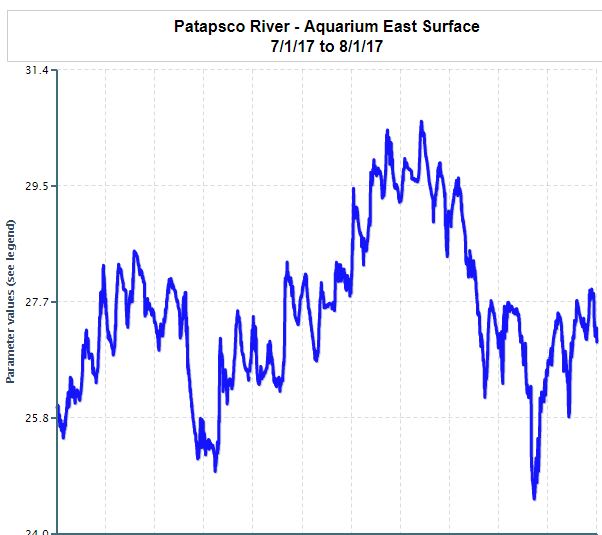
3. Continuous Monitoring Charts & Data Download (opens in a new tab):
Query for Continuous Monitoring 15-minute increment data, and choose to view your selection as a chart, download raw data, or view and download mean, minimum, and maximum values by year, month, or both. Copy the resulting URL to easily send collaborators your chart or data download.
Want to compare conditions at two different stations? Use our Continuous Monitoring Station Comparison Chart and Data Download Tools instead.
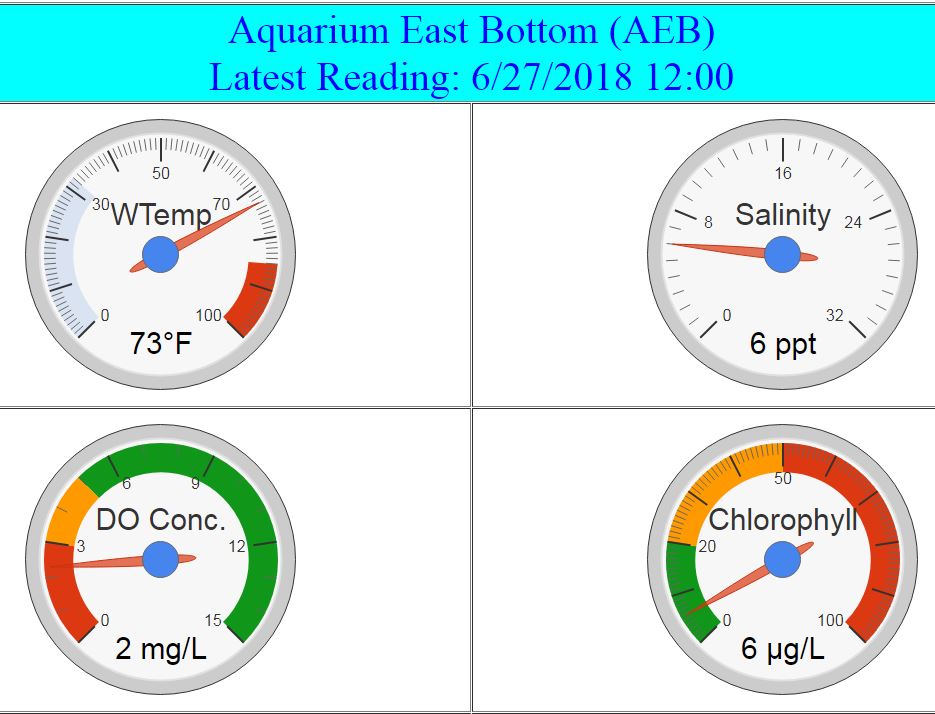
4. Continuous Monitoring Real-time Data Gauges:
See a quick view of the most recently recorded data from our real-time telemetered data stations, available in our easy-to-read gauge view, or in table form. Bookmark the pages for your stations of interest on your mobile device to easily monitor them! For example, here's the link for Mallows Bay data: https://eyesonthebay.dnr.maryland.gov/m/index.cfm?StationList=MAB&radiobutton=gauge (opens in a new tab)
Long Term Fixed Station Monthly Monitoring Program:
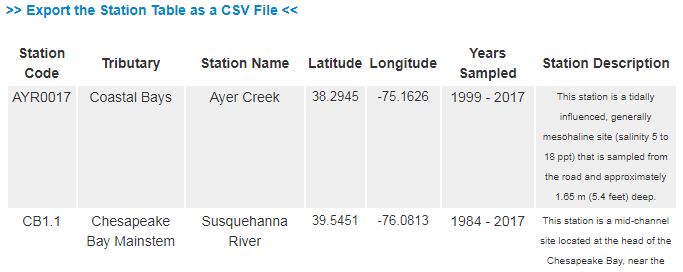
1. Fixed Station Information Table & DataHub Data Download: (opens in a new tab)
You can view and download Long Term Monthly Monitoring Station Information in table form, including station coordinates and depth locations. Where data are available, there are direct data download links to all available Eyes on the Bay Longterm Monthly Monitoring Data.
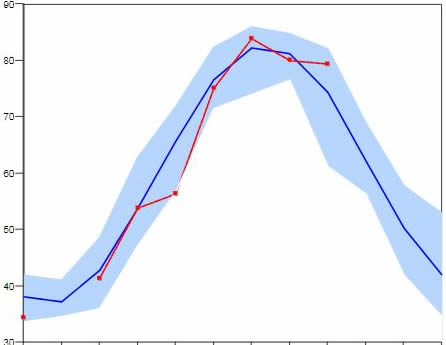
2. Fixed Station Monthly Monitoring Current vs Historical Charts: (opens in a new tab)
Long term sampling has been conducted once or twice monthly since 1985. The Fixed Station Current vs Historical charts plot water quality values from the current month with the historical range (minimum to maximum recorded values) and the historical average.
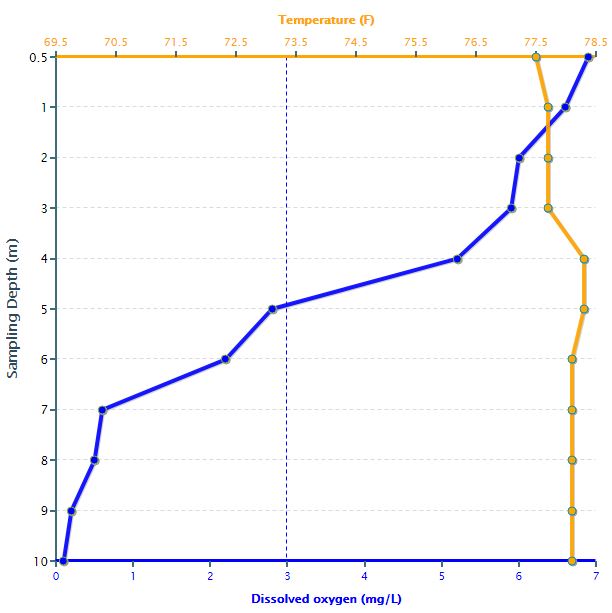
3. Fixed Station Monthly Monitoring Profile Charts (opens in a new tab):
Water quality data from our Long Term Monthly Monitoring Program is collected at ~1m depth intervals and is known as a 'water quality profile'. In this data query you can choose to view a profile chart comparing two water quality parameters to see how values change with depth.
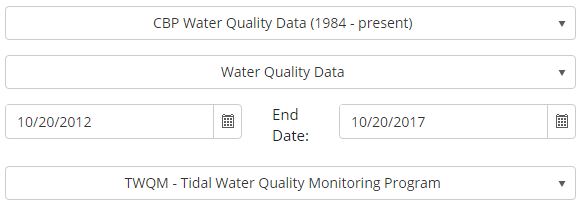
4. Fixed Station Monthly Monitoring Data Download (opens in a new tab):
The Fixed Station Monthly Monitoring data can be downloaded from the Chesapeake Bay Program's DataHub (opens in a new tab). These data are the backbone of the Chesapeake and Coastal Bays management and restoration efforts.
DATAFLOW Surface Mapping Program:
1. DATAFLOW Surface Mapping Program Description (opens in a new tab):
Read more in-depth about the DATAFLOW Surface Mapping Program, including the background of the program, how data are collected, and how these data may address many key management issues in Chesapeake Bay.
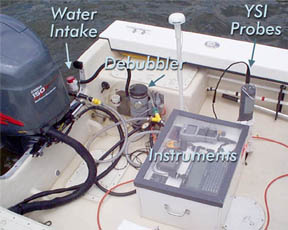
2. DATAFLOW Instrumentation Details (opens in a new tab):
Visit the DATAFLOW Instrumentation page for in-depth details about the technology used, as well as photos and a diagram of the setup.
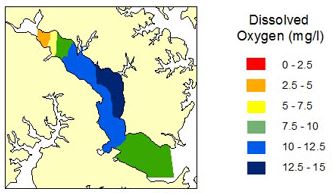
3. View Integrated DATAFLOW Maps and Data Download (opens in a new tab):
View data-integrated surface maps of DATAFLOW data based on your selected tributary and sampling date. There's also an option to download these data for your own use.
Vertical Profiler:
1. Vertical Profiler Data (opens in a new tab):
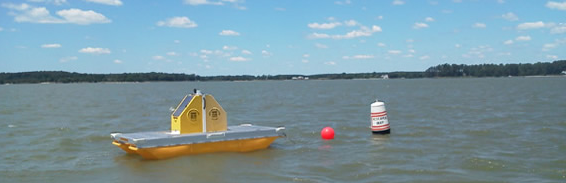
The vertical profiler is a monitoring instrument specifically designed for measuring water quality at multiple vertical locations in the water column. The system consists of a controller, winch, and data logging and telemetry system mounted on a floating platform. The winch is used to lower the datasonde down into the water column. The links below allow you to query for current year or from five stations of archived Vertical Profiler data, as well as view the data in chart form at the stations currently deployed.
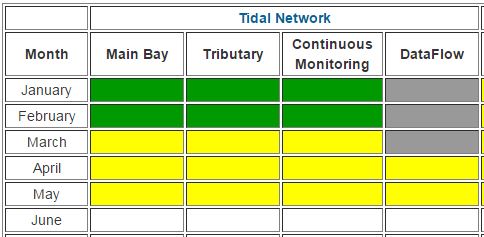
Data Status (opens in a new tab):
Our Data Status page shows an overview of the monthly status of Eyes on the Bay data submittals to the Environmental Protection Agency's Chesapeake Bay Program Data Hub for each data type. You can use this page to find out when data have been finalized and are available online.
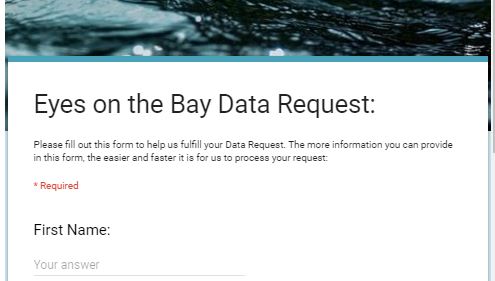
Data Request Form (opens in a new tab):
The majority of our data is available for direct download on this site, or on the Chesapeake Bay Program Data Hub. However, if the data you need is not available at either location, then it is possible to Submit a Data Request (opens in a new tab) using our online form. Please refer to the tools above to help determine what type of data, and what stations you are interested in, before requesting data.
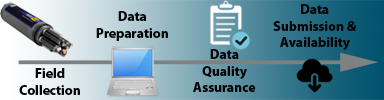
Data Process:
Wondering what the steps are between when we gather the data and when it's available online? Check out this schematic of our entire Data Process, outlining the steps from sampling to data submission.