
Mallows Bay Charts and Data Summary
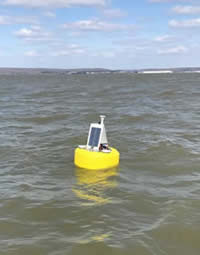
The Maryland Department of Natural Resources is partnering with the National Marine Sanctuary Foundation (opens in new window) to deploy and maintain a real-time water quality monitoring buoy at Mallows Bay in the Potomac River. To read more details about our partnership, click here (opens in new window).
The charts and tables below display the most recent 7 days of data from Mallows Bay.
Note: Current year data are provisional and have not yet been through our rigorous Quality Assurance procedures.
Hints:
-Click on parameters in the legend to toggle them on/off in the chart.
-Drag and select an area of the chart to zoom in.
Mallows Bay Daily Means:
| Sample Date |
Avg Sal (ppt) |
Avg Temp (°C) |
Avg Temp (°F) |
Avg DO (mg/L) |
Avg DO% (%Sat) |
Avg pH | Avg Turb (NTU) |
Avg Chl (µg/L) |
Avg BGA (RFU) |
|---|---|---|---|---|---|---|---|---|---|
| 3/29/26 | . | ||||||||
| 3/28/26 | . | ||||||||
| 3/27/26 | . | ||||||||
| 3/26/26 | 0.5 | 11.6 | 53.0 | 10.1 | 92.9 | 7.92 | 20.2 | 4.5 | . |
| 3/25/26 | 0.8 | 11.0 | 51.7 | 10.2 | 93.3 | 7.95 | 19.5 | 4.2 | . |
| 3/24/26 | 1.2 | 11.0 | 51.8 | 10.3 | 93.9 | 7.95 | 21.1 | 4.4 | . |
Mallows Bay (MAB) Weather Data
The Mallows Bay buoy (opens in new window) now has an integrated weather data system that telemeters near-real time weather data to our database, along with water quality readings. Below are the most recent barometric pressure, air temperature, and wind speed and direction readings. The calculation of whether barometric pressure is rising, falling, or steady is derived from comparing the most recent value to the value recorded from an hour prior.
Latest weather data from: 3/29/26 6:00 PM EST
| Parameter | Measurement |
|---|---|
| Air Temperature: | 55.4 °F |
| Barometric Pressure: | 30.4 mmHg & steady |
| Wind Speed & Direction: | 11.9 knots from SSW (199 °) |
Wind data displayed above is from 3/29/2026 from 5:15 PM to 06:00 PM, EST
How to read a compass rose wind chart:
- Read the wind rose like a compass to determine wind direction. A 'ray' extending towards one of the directions indicates the wind was blowing FROM that direction, not toward it.
TIP: Hover over a ray to display a 'tooltip' with the data values. - Determine wind speed by examining the rings. As you move out from the center, the rings act as a measure of wind speed. Each ring is marked with wind speed in knots. The length of the ray, based on the ring's measurements, tells you the wind speed in knots.
- Weather measurements are recorded every 15 minutes. This chart plots the 4 latest wind speed and magnetic wind direction values, displaying the last hour of wind data.