JCR 2019 DNR Water Habitat Quality
C. Chesapeake Bay Water Quality Monitoring Data
In order to understand the health of the Chesapeake Bay and track progress of restoration efforts, the state, through the Maryland Department of Natural Resources, regularly monitors tidal and non-tidal waters at 125 sites. Monitoring data provides highly accurate information on the amount of pollutants in our waterways today and in the past. Monitoring data cannot, however, identify the sources of the pollutants nor predict future pollutant loads resulting from planned pollutant reduction efforts, the impacts of climate change, growth, etc. - for that information we must depend on models.
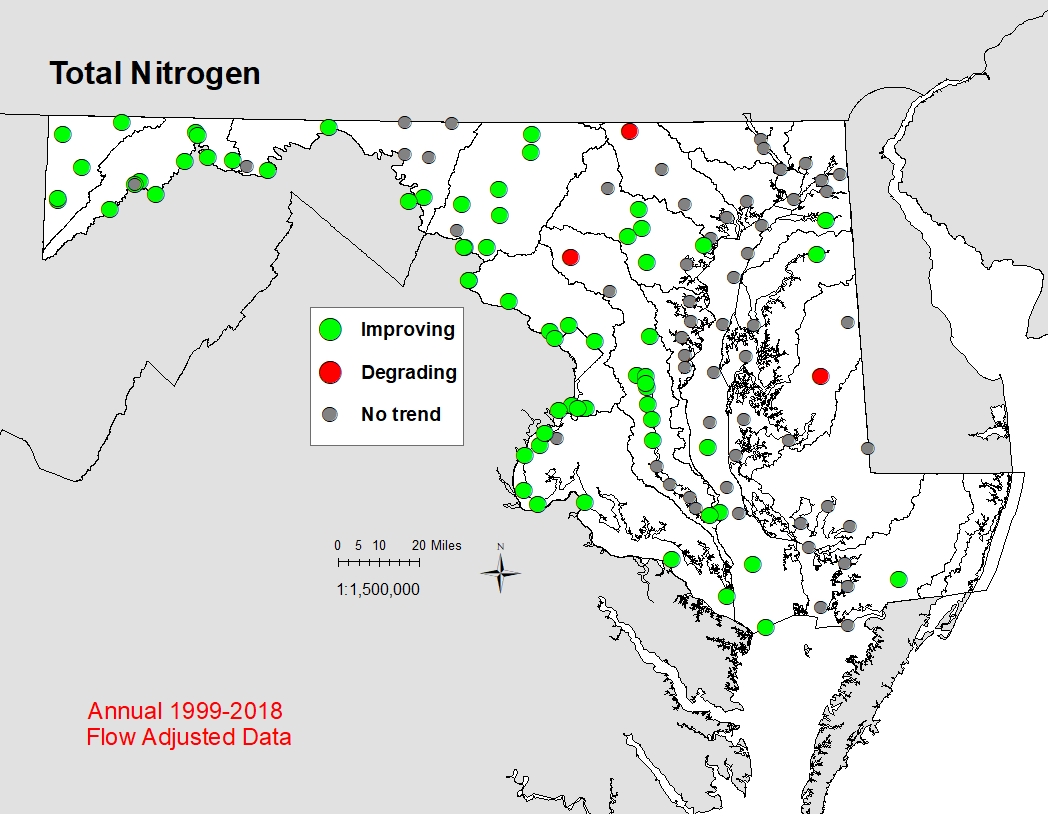
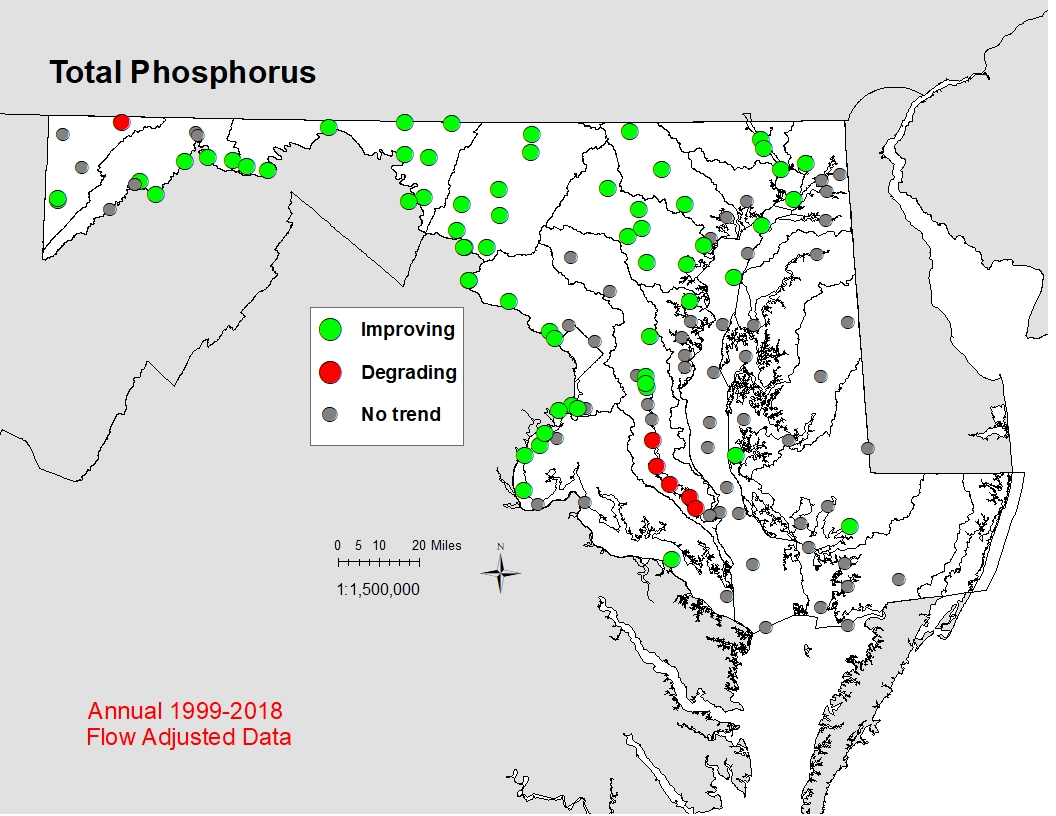
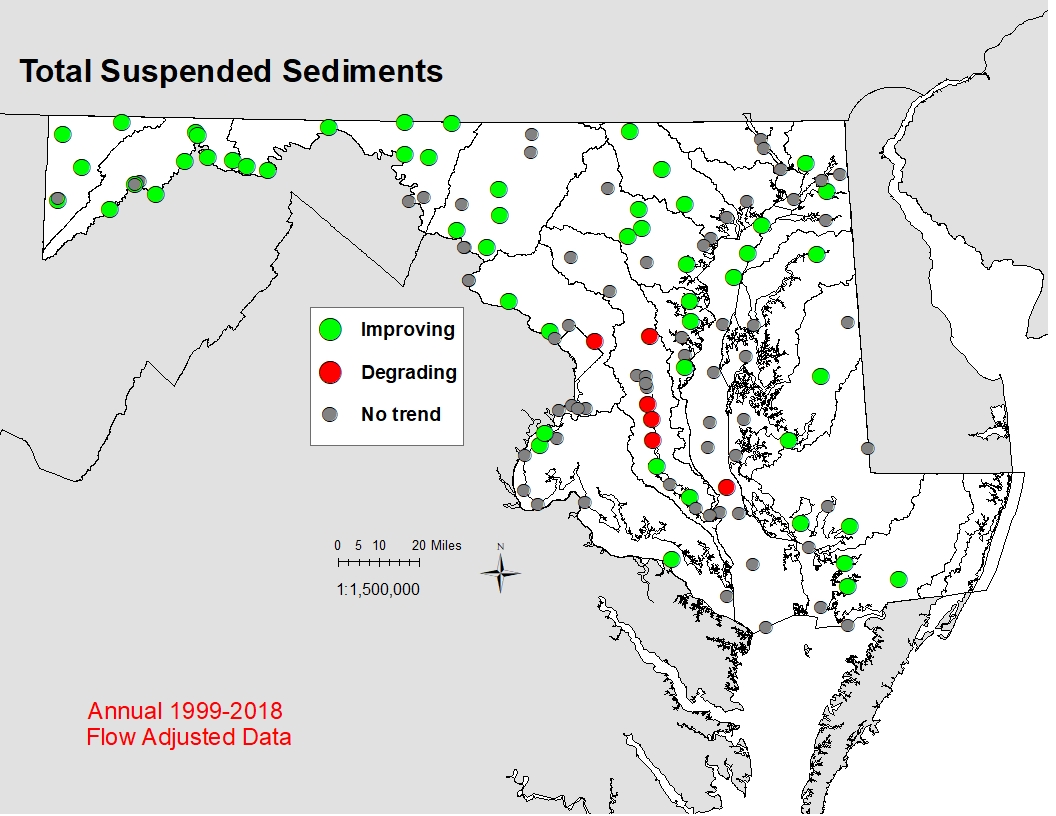
Statistical analysis of monitoring data collected at both tidal and non-tidal stations from 1999 through 2018 demonstrates that the current impact of historical Chesapeake Bay restoration spending has resulted in significant reductions in nitrogen concentrations at 53 percent of stations (Figure 4), phosphorus concentrations at 50 percent of stations (Figure 5), and sediment concentrations at 42 percent of stations (Figure 6). [Note: report continues below figures]
Over the last several years, the Environmental Protection Agency, Maryland, and the other Bay states staff have worked to develop new statistical methods to assess water quality trends. A new method was first implemented in 2017 and has been further refined in the 2019 analysis. This refined method uses daily flow data from United States Geological Service (USGS) gaging stations to include the impact of changes in river flow on the nutrients and sediments levels; higher nutrients and sediments are associated with high river flows. Changes in the levels of nutrients and sediments are ‘flow adjusted’ by using flow as one of the factors that determines the differences between years. The new ’flow adjusted’ method is much more robust for determining the impact of changes in water quality over a long-time period and for determining what changes over time have resulted from management actions, not due to changes in rainfall from one year to the next. When the results of the new ‘flow adjusted’ method are compared to the results of the previous non-adjusted method there are some differences, especially when the most recent year of data (2018) was a record setting high flow year.
Monitoring results confirm that most of the reductions in the amount of nutrients and sediment in the water occur in streams and rivers closest to where the management actions have been implemented on the land in the watershed. Moving downstream into the tidal tributaries, water quality improvements, especially in nitrogen levels, are more likely to be observed on Maryland’s western shore where those reductions are associated with wastewater treatment plant upgrades. Conversely, water quality improvements on Maryland’s eastern shore, which are dominated by diffuse nonpoint source impacts, have a more delayed response. By using the ‘flow adjusted’ method, we can see that some areas are in need of continued focus for management actions, in particular the middle and lower Patuxent River.
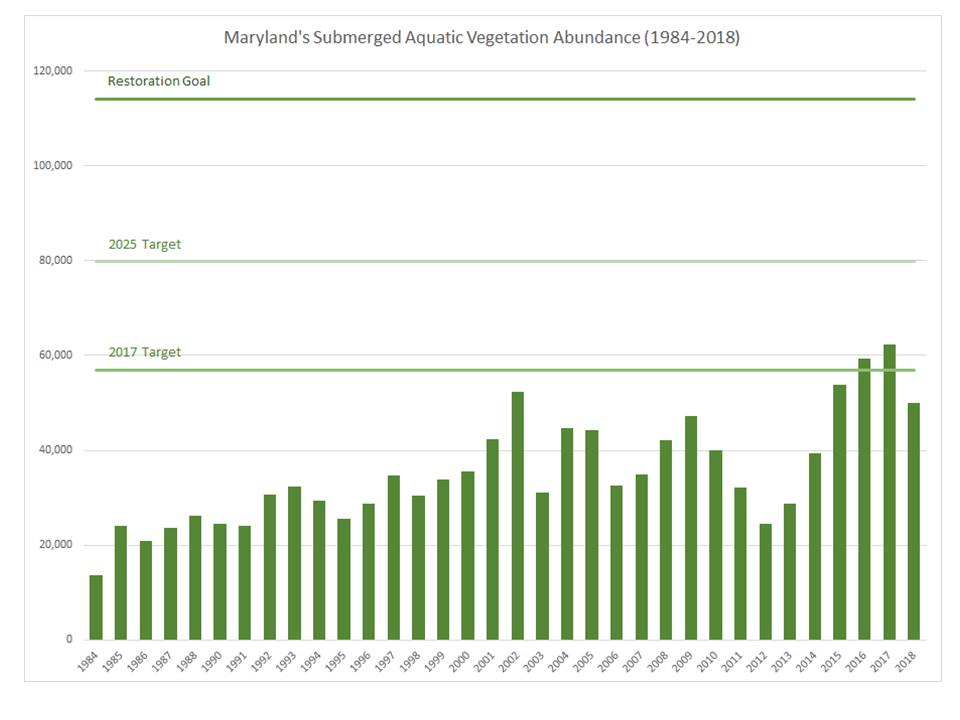
The main portion of the Bay itself will take even longer to respond to our management actions, but we are seeing some improvements as we continue to implement and meet our reduction strategies. For instance, Maryland’s submerged aquatic vegetation exceeded 50,000 acres in 2018 (Figure 7). Submerged aquatic vegetation is a key indicator of Bay health since it quickly responds to improvements in water quality. As such, sustaining and increasing the habitat benefits of submerged aquatic vegetation is a vital Bay Agreement outcome. Maryland’s progress towards this goal was measured against a target of 57,000 acres by 2017, which was met in 2016 and 2017, and 79,800 acres by 2025.
|
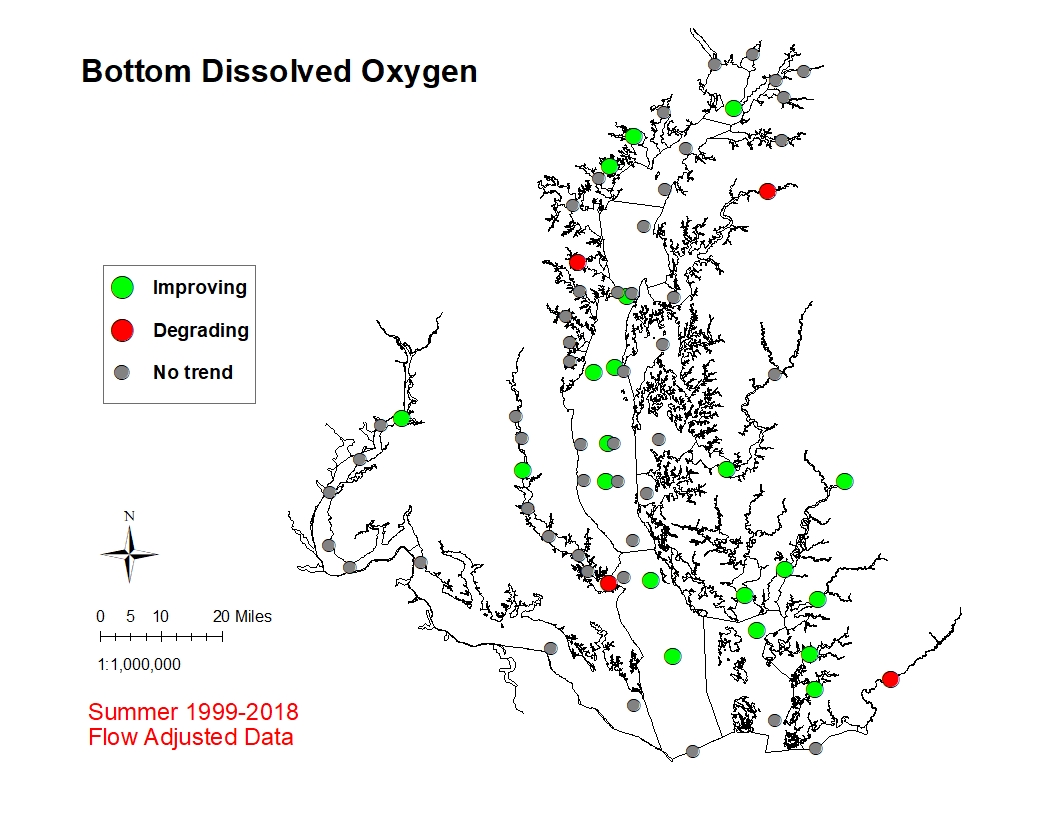
In addition, we are also seeing signs of improved bottom dissolved oxygen levels, a key parameter for all aquatic resources and an indicator of overall Bay health (Figure 8).
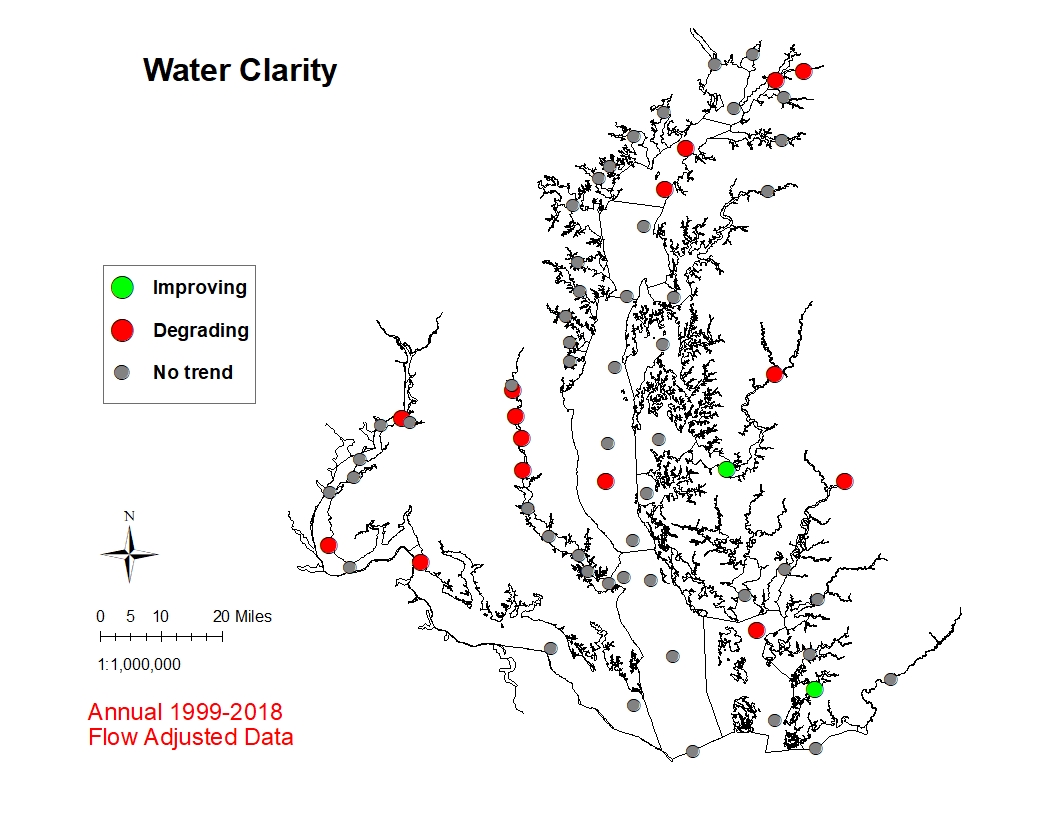
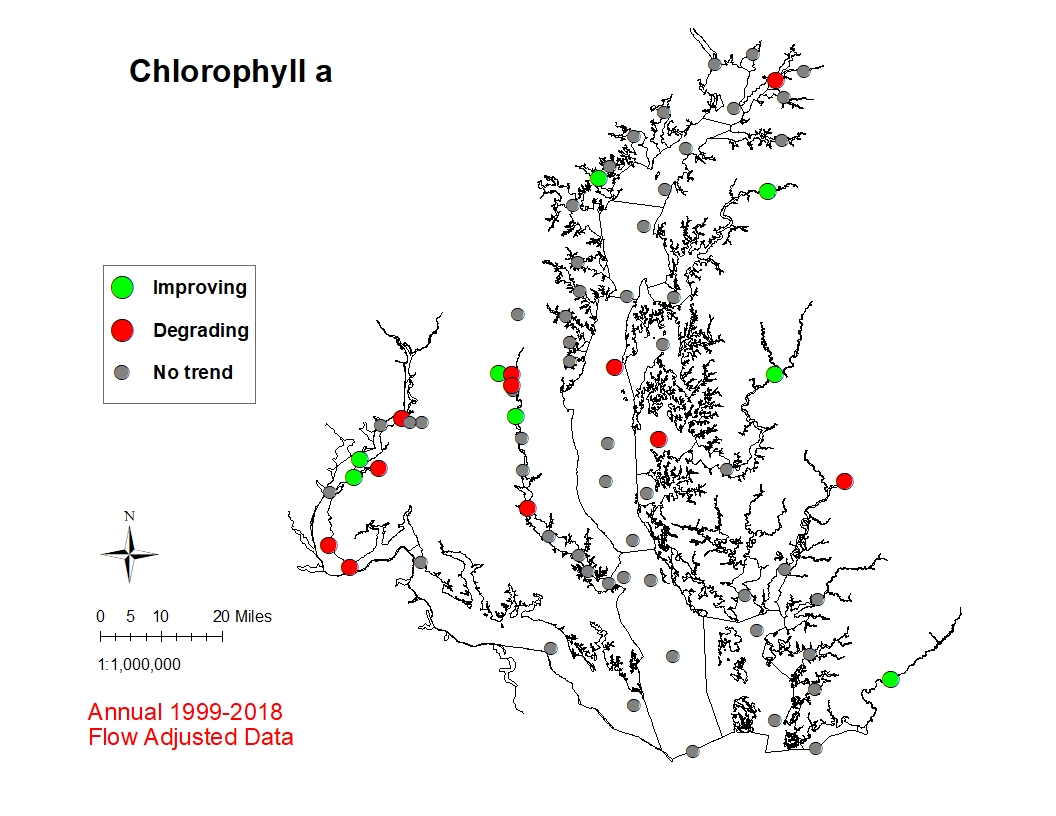
Despite the above referenced encouraging signs of improvements in Chesapeake Bay grasses and bottom dissolved oxygen, further actions on nutrients and sediments are required to see continued movement in the right direction and corresponding improvements in tidal water clarity (Figure 9) and chlorophyll a, an indicator of algal concentration (Figure 10).

