
| April 11, 2019 Coastal Bays Set State Algae Record |
|||||||||||||||||||||||||||||||||||||||||||||||||||||||||
|
Follow up to Maryland Coastal Bays experience unusual winter Mahogany Tide (March 19, 2019). |
|||||||||||||||||||||||||||||||||||||||||||||||||||||||||
|
An unusual Mahogany Tide, caused by the algal species Prorocentrum minimum, occurred this past winter in the Maryland Coastal Bays. Laboratory data are now available for 2018 bloom and show cell concentrations greater than any that had been measured during the past two decades of monitoring. Turville Creek showed peak bloom concentrations in November 2018 while Bishopville Prong had the highest chlorophyll concentration in December 2018. New maximum levels were recorded in the St Martin River (753 μg/L in the middle St Martin River by Ocean Pines) and at two sites in Turville Creek (243.5 μg/L downstream of where Herring and Turville merge) and (306.5 μg/L upstream near the golf course). The highest algae abundance (measured as chlorophyll) ever documented in the Coastal Bays (or the State) was observed in Bishopville Prong in December (chlorophyll a = 953 μg/L). The St Martin River has had frequent harmful algal blooms documented as a result of high nutrients (https://dnr.maryland.gov/waters/coastalbays/Documents/Ch6.2.pdf). In the ~20 year dataset (1999-2015), chlorophyll values exceeding 200 μg/L have been seen 37 times (out of >8500 samples). Values over 300 μg/L have been observed 16 times, while chlorophyll exceeded 400 μg/L only 6 times, with one sample having a concentration >700 μg/L. In 2018, the 700 μg/L chlorophyll maxima was exceeded twice. For comparison, the highest chlorophyll value ever recorded during 34 years of monitoring in the Chesapeake Bay was 723 μg/L. |
|||||||||||||||||||||||||||||||||||||||||||||||||||||||||
| Table 1: Number of occurrences of chlorophyll exceeding different levels in the Coastal Bays. | |||||||||||||||||||||||||||||||||||||||||||||||||||||||||
|
|||||||||||||||||||||||||||||||||||||||||||||||||||||||||
|
|
|||||||||||||||||||||||||||||||||||||||||||||||||||||||||
|
|||||||||||||||||||||||||||||||||||||||||||||||||||||||||
|
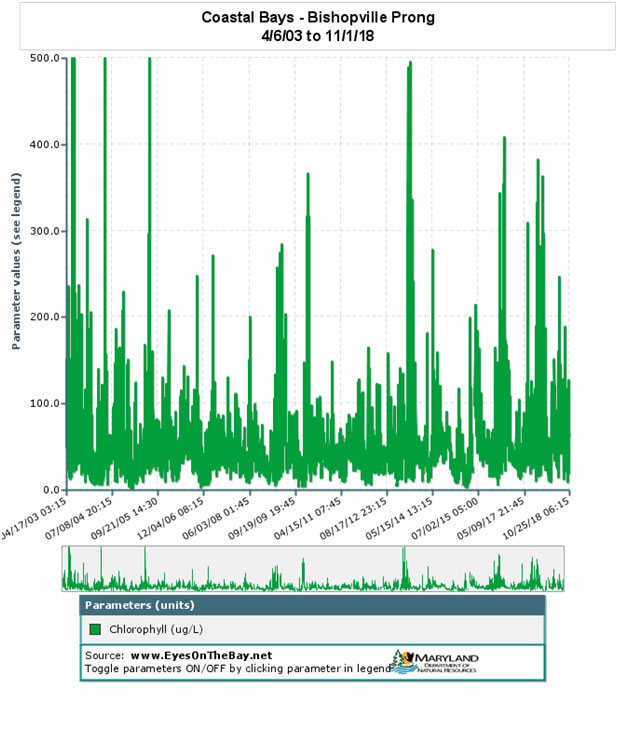
Figure 1 DNR long term chlorophyll abundance data from Bishopville Prong continuous monitoring site (2003-2018). Note data is only available through October 25, 2018 when the site was pulled for the season. |
|||||||||||||||||||||||||||||||||||||||||||||||||||||||||
Lab and field data for November and December 2018
|
|||||||||||||||||||||||||||||||||||||||||||||||||||||||||
|
|||||||||||||||||||||||||||||||||||||||||||||||||||||||||