
DATAFLOW Data
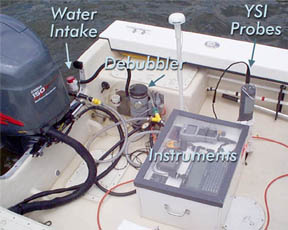
The surface mapping program collects data every 4 seconds aboard a moving boat, using an instrument suite known as DATAFLOW (opens in new tab). DATAFLOW uses a pump on the transom of the boat to feed surface water through a chamber where water quality is measured by a sonde/instrument similar to those used in the continuous monitoring program. The water quality data are geo-referenced with a GPS unit and recorded in an onboard computer. The boat follows a path that records surface water quality both in nearshore shallow areas and mid-channel areas of rivers and the Chesapeake.
Data are used to assess water quality criteria, particularly the extent of acceptable habitat for underwater grasses. Data are also used to assess the scale of events such as algal blooms or runoff and pinpoint regions that require management action to improve water quality. For a more in-depth description of the DATAFLOW mapping program, click here (opens in new tab).
For a link to a map of calibration stations for all shallow water monitoring programs, visit the Calibration Station Map (opens in new tab).
DATAFLOW Data Download:
(2001 - 2026*)
Quality Assured DATAFLOW data have been through rigorous Quality Assurance and Quality Control. Download our DATAFLOW data directly based on sampling location and sampling date.
* Final, quality-assured data for the current year will be made available after the monitoring season, which ends in October.
Click here to download DataFlow Data
DATAFLOW Data Integrated Surface Maps:
Use our DATAFLOW Map Query to view spatially interpolated maps of surface water quality data, based on a station(s) and date(s) of your choosing.